Class WCartesianChart
public class WCartesianChart
extends WAbstractChart
A cartesian chart is a chart that uses X and Y axes. It can display one or multiple data series, which each may be rendered using bars, lines, areas, or points.
To use a cartesian chart, the minimum you need to do is set a model using WAbstractChart#setModel(), set the model
column that holds the X data using setXSeriesColumn(), and add one or more series using addSeries(). Each series corresponds to one data
column that holds Y data.
A cartesian chart is either a ChartType.CategoryChart or a ChartType.ScatterPlot.
In a CategoryChart, the X series represent different categories, which are listed
consecutively in model row order. The X axis scale is set to AxisScale.CategoryScale.
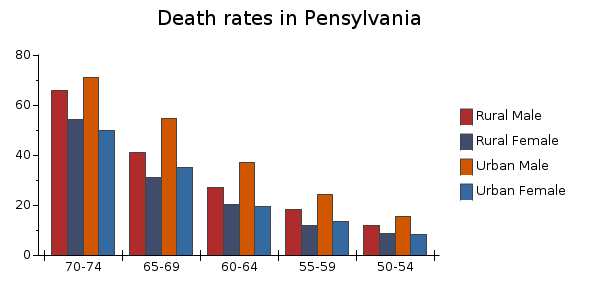
A category chart with bar series
Each series may be rendered differently, and this is configured in the data series (see WDataSeries for more information).
In a ScatterPlot, the X series data are interpreted as numbers on a numerical scale.
The scale for the X axis defaults to a AxisScale.LinearScale, but this may be changed to
a AxisScale.DateScale when the X series contains dates (of type WDate) to create a time series chart, or to a AxisScale.LogScale. A
ScatterPlot supports the same types of data series as a CategoryChart, but does not support
stacking. In a scatter plot, the X series do not need to be ordered in increasing values, and may
be set differently for each dataseries using WDataSeries#setXSeriesColumn().
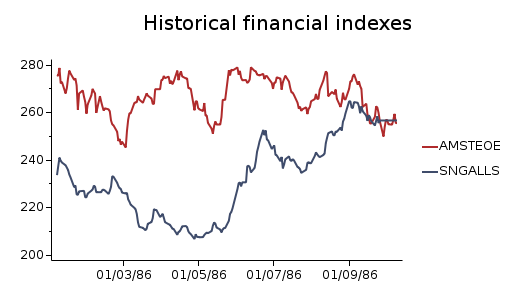
A time series scatter plot with line series
Missing data in a model series Y values is interpreted as a break. For curve-like series, this breaks the curve (or line).
The cartesian chart has support for dual Y axes. Each data series may be bound to one of the two Y axes. By default, only the first Y axis is displayed. To show the second Y axis you will need to call:
By default a chart has a horizontal X axis and a vertical Y axis, which corresponds to a
Orientation.Vertical orientation. The orientation may be changed to Orientation.Horizontal using setOrientation().
The styling of the series data are dictated by a palette which may be set using WAbstractChart#setPalette(), but may be
overridden by settings in each data series.
CSS
Styling through CSS is not applicable.
Client-side interaction
WCartesianChart has several features that allow interaction with the chart without server roundtrips. These features include zoom, pan, crosshair and follow curve functionality.
Note: Client side interaction is only available if the chart is drawn on an HTML
canvas. This is the default rendering method on modern browsers, see WPaintedWidget#setPreferredMethod()
Note: Some features are currently not supported in interactive mode:
WAxis#setBreak() is incompatible
with interactive mode
- See Also:
WDataSeries,WAxis,WPieChart
-
Nested Class Summary
Nested classes/interfaces inherited from class eu.webtoolkit.jwt.WPaintedWidget
WPaintedWidget.MethodNested classes/interfaces inherited from class eu.webtoolkit.jwt.WObject
WObject.FormData -
Field Summary
Fields inherited from class eu.webtoolkit.jwt.WInteractWidget
dragTouchEndSlot_, dragTouchSlot_ -
Constructor Summary
Constructors Constructor Description WCartesianChart()Creates a new cartesian chart.WCartesianChart(ChartType type)Creates a new cartesian chart.WCartesianChart(ChartType type, WContainerWidget parent)Creates a new cartesian chart.WCartesianChart(WContainerWidget parent)Creates a new cartesian chart. -
Method Summary
Modifier and Type Method Description voidaddCurveLabel(CurveLabel label)Add a curve label.voidaddDataPointArea(WDataSeries series, int xRow, int xColumn, WAbstractArea area)Adds a data point area (used for displaying e.g.voidaddSeries(WDataSeries series)Adds a data series.intaddXAxis(WAxis waxis)Adds a X axis to this chart.intaddYAxis(WAxis waxis)Adds a Y axis to this chart.protected voidcalcChartArea()Calculates the chart area.protected WRectFchartSegmentArea(WAxis yAxis, int xSegment, int ySegment)Returns the segment area for a combination of X and Y segments.protected WRectFchartSegmentArea(WAxis xAxis, WAxis yAxis, int xSegment, int ySegment)Returns the segment area for a combination of X and Y segments.voidclearCurveLabels()Clear all curve labels.voidclearXAxes()Clears all X axes.voidclearYAxes()Clears all Y axes.WWidgetcreateLegendItemWidget(int index)Creates a widget which renders the a legend item.voiddisableFollowCurve()Disable the follow curve functionality.voiddrawMarker(WDataSeries series, WPainterPath result)Draws the marker for a given data series.WAxisgetAxis(Axis axis)Returns a chart axis.intgetAxisPadding()Returns the padding between the chart area and the axes.doublegetBarMargin()Returns the margin between bars of different series.WPengetBorderPen()Returns the pen used to draw the border around the chart area.protected intgetCalcNumBarGroups()Calculates the total number of bar groups.WColorgetCrosshairColor()Returns the crosshair color.intgetCrosshairXAxis()Returns the X axis to use for the crosshair.intgetCrosshairYAxis()Returns the Y axis to use for the crosshair.java.util.List<CurveLabel>getCurveLabels()Get all of the registered curve labels.protected voidgetDomChanges(java.util.List<DomElement> result, WApplication app)Get DOM changes for this widget.WDataSeriesgetFollowCurve()Returns the curve that is to be followed.AlignmentFlaggetLegendAlignment()Returns the legend alignment.WBrushgetLegendBackground()Returns the legend background brush.WPengetLegendBorder()Returns the legend border pen.intgetLegendColumns()Returns the legend columns.WLengthgetLegendColumnWidth()Returns the legend column width.WFontgetLegendFont()Returns the legend font.LegendLocationgetLegendLocation()Returns the legend location.SidegetLegendSide()Returns the legend side.WBrushgetLoadingBackground()Returns the background brush for the unloaded area.OrientationgetOrientation()Returns the chart orientation.WDataSeriesgetSelectedSeries()Get the currently selected curve.java.util.List<WDataSeries>getSeries()Returns a list with the current data series.WDataSeriesgetSeries(int modelColumn)Returns a data series corresponding to a data column.ChartTypegetType()Returns the chart type.java.util.Map<java.util.EnumSet<KeyboardModifier>,InteractiveAction>getWheelActions()Returns the current mouse wheel actions for interactive charts.java.util.List<WAxis>getXAxes()Returns a vector of all X axes associated with this chart.WAxisgetXAxis(int i)Retrieves the X axis at index i.intgetXAxisCount()Returns the number of X axes associated with this chart.java.util.List<WAxis>getYAxes()Returns a vector of all Y axes associated with this chart.WAxisgetYAxis(int i)Retrieves the Y axis at index i.intgetYAxisCount()Returns the number of Y axes associated with this chart.protected WPointFhv(double x, double y)Conversion between chart and painter coordinates.protected WPointFhv(WPointF p)Conversion between chart and painter coordinates.protected WRectFhv(WRectF r)Conversion between chart and painter coordinates.booleaninitLayout()Initializes the chart layout.booleaninitLayout(WRectF rectangle)Initializes the chart layout.booleaninitLayout(WRectF rectangle, WPaintDevice device)Initializes the chart layout.booleanisCrosshairEnabled()Returns whether the crosshair is enabled.booleanisCurveManipulationEnabled()Returns whether curve manipulation is enabled.booleanisLegendEnabled()Returns whether the legend is enabled.booleanisOnDemandLoadingEnabled()Returns whether on-demand loading is enabled.booleanisPanEnabled()Returns whether pan is enabled.booleanisRubberBandEffectEnabled()Checks whether the rubberband effect is enabled.booleanisSeriesSelectionEnabled()Returns whether series selection is enabled.booleanisZoomEnabled()Returns whether zoom is enabled.voiditerateSeries(SeriesIterator iterator, WPainter painter)voiditerateSeries(SeriesIterator iterator, WPainter painter, boolean reverseStacked)voiditerateSeries(SeriesIterator iterator, WPainter painter, boolean reverseStacked, boolean extremesOnly)protected WPointFmap(double xValue, double yValue)Map (x, y) value pair to chart coordinates coordinates.protected WPointFmap(double xValue, double yValue, int yAxis)Map (x, y) value pair to chart coordinates coordinates.protected WPointFmap(double xValue, double yValue, int yAxis, int currentXSegment)Map (x, y) value pair to chart coordinates coordinates.protected WPointFmap(double xValue, double yValue, int yAxis, int currentXSegment, int currentYSegment)Map (x, y) value pair to chart coordinates coordinates.protected WPointFmap(double xValue, double yValue, Axis yAxis)Map (x, y) value pair to chart coordinates coordinates.protected WPointFmap(double xValue, double yValue, Axis yAxis, int currentXSegment)Map (x, y) value pair to chart coordinates coordinates.protected WPointFmap(double xValue, double yValue, Axis yAxis, int currentXSegment, int currentYSegment)Map (x, y) value pair to chart coordinates coordinates.protected WPointFmap(double xValue, double yValue, WAxis xAxis, WAxis yAxis)Map (x, y) value pair to chart coordinates coordinates.protected WPointFmap(double xValue, double yValue, WAxis xAxis, WAxis yAxis, int currentXSegment)Map (x, y) value pair to chart coordinates coordinates.protected WPointFmap(double xValue, double yValue, WAxis xAxis, WAxis yAxis, int currentXSegment, int currentYSegment)Map (x, y) value pair to chart coordinates coordinates.WPointFmapFromDevice(WPointF point)Maps from device coordinates to model coordinates.WPointFmapFromDevice(WPointF point, int ordinateAxis)Maps from device coordinates to model coordinates.WPointFmapFromDevice(WPointF point, Axis ordinateAxis)Maps from device coordinates to model coordinates.WPointFmapFromDevice(WPointF point, WAxis xAxis, WAxis yAxis)Maps from device coordinates to model coordinates.WPointFmapFromDeviceWithoutTransform(WPointF point)Maps from device coordinates to model coordinates, ignoring the current zoom range.WPointFmapFromDeviceWithoutTransform(WPointF point, int ordinateAxis)Maps from device coordinates to model coordinates, ignoring the current zoom range.WPointFmapFromDeviceWithoutTransform(WPointF point, Axis ordinateAxis)Maps from device coordinates to model coordinates, ignoring the current zoom range.WPointFmapFromDeviceWithoutTransform(WPointF point, WAxis xAxis, WAxis yAxis)Maps from device coordinates to model coordinates, ignoring the current zoom range.WPointFmapToDevice(java.lang.Object xValue, java.lang.Object yValue)Maps model values onto chart coordinates.WPointFmapToDevice(java.lang.Object xValue, java.lang.Object yValue, int axis)Maps model values onto chart coordinates.WPointFmapToDevice(java.lang.Object xValue, java.lang.Object yValue, int axis, int xSegment)Maps model values onto chart coordinates.WPointFmapToDevice(java.lang.Object xValue, java.lang.Object yValue, int axis, int xSegment, int ySegment)Maps model values onto chart coordinates.WPointFmapToDevice(java.lang.Object xValue, java.lang.Object yValue, Axis axis)Maps model values onto chart coordinates.WPointFmapToDevice(java.lang.Object xValue, java.lang.Object yValue, Axis axis, int xSegment)Maps model values onto chart coordinates.WPointFmapToDevice(java.lang.Object xValue, java.lang.Object yValue, Axis axis, int xSegment, int ySegment)Maps model values onto chart coordinates.WPointFmapToDevice(java.lang.Object xValue, java.lang.Object yValue, WAxis xAxis, WAxis yAxis)Maps model values onto chart coordinates.WPointFmapToDevice(java.lang.Object xValue, java.lang.Object yValue, WAxis xAxis, WAxis yAxis, int xSegment)Maps model values onto chart coordinates.WPointFmapToDevice(java.lang.Object xValue, java.lang.Object yValue, WAxis xAxis, WAxis yAxis, int xSegment, int ySegment)Maps model values onto chart coordinates.WPointFmapToDeviceWithoutTransform(java.lang.Object xValue, java.lang.Object yValue)Maps model values onto chart coordinates, ignoring the current zoom range.WPointFmapToDeviceWithoutTransform(java.lang.Object xValue, java.lang.Object yValue, int ordinateAxis)Maps model values onto chart coordinates, ignoring the current zoom range.WPointFmapToDeviceWithoutTransform(java.lang.Object xValue, java.lang.Object yValue, int ordinateAxis, int xSegment)Maps model values onto chart coordinates, ignoring the current zoom range.WPointFmapToDeviceWithoutTransform(java.lang.Object xValue, java.lang.Object yValue, int ordinateAxis, int xSegment, int ySegment)Maps model values onto chart coordinates, ignoring the current zoom range.WPointFmapToDeviceWithoutTransform(java.lang.Object xValue, java.lang.Object yValue, Axis ordinateAxis)Maps model values onto chart coordinates, ignoring the current zoom range.WPointFmapToDeviceWithoutTransform(java.lang.Object xValue, java.lang.Object yValue, Axis ordinateAxis, int xSegment)Maps model values onto chart coordinates, ignoring the current zoom range.WPointFmapToDeviceWithoutTransform(java.lang.Object xValue, java.lang.Object yValue, Axis ordinateAxis, int xSegment, int ySegment)Maps model values onto chart coordinates, ignoring the current zoom range.WPointFmapToDeviceWithoutTransform(java.lang.Object xValue, java.lang.Object yValue, WAxis xAxis, WAxis yAxis)Maps model values onto chart coordinates, ignoring the current zoom range.WPointFmapToDeviceWithoutTransform(java.lang.Object xValue, java.lang.Object yValue, WAxis xAxis, WAxis yAxis, int xSegment)Maps model values onto chart coordinates, ignoring the current zoom range.WPointFmapToDeviceWithoutTransform(java.lang.Object xValue, java.lang.Object yValue, WAxis xAxis, WAxis yAxis, int xSegment, int ySegment)Maps model values onto chart coordinates, ignoring the current zoom range.protected voidmodelChanged()protected voidmodelReset()voidpaint(WPainter painter, WRectF rectangle)Paint the chart in a rectangle of the given painter.protected voidpaintEvent(WPaintDevice paintDevice)Paints the widget.protected booleanprepareAxes(WPaintDevice device)Prepares the axes for rendering.voidremove()Destructor.voidremoveSeries(int modelColumn)Deprecated.voidremoveSeries(WDataSeries series)Removes a data series.voidremoveXAxis(int xAxisId)Removes the X axis with the given id.voidremoveYAxis(int yAxisId)Removes the Y axis with the given id.protected voidrender(WPainter painter, WRectF rectangle)Renders the chart.protected voidrender(java.util.EnumSet<RenderFlag> flags)Renders the widget.protected voidrenderAxes(WPainter painter, AxisProperty propertie, AxisProperty... properties)Renders one or more properties of the axes.protected voidrenderAxes(WPainter painter, java.util.EnumSet<AxisProperty> properties)Renders one or more properties of the axes.protected voidrenderAxis(WPainter painter, WAxis axis, AxisProperty propertie, AxisProperty... properties)Renders properties of one axis.protected voidrenderAxis(WPainter painter, WAxis axis, java.util.EnumSet<AxisProperty> properties)Renders properties of one axis.protected voidrenderBackground(WPainter painter)Renders the background.protected voidrenderBorder(WPainter painter)Renders the border of the chart area.protected voidrenderCurveLabels(WPainter painter)Renders the curve labels.protected voidrenderGrid(WPainter painter, WAxis ax)Renders grid lines along the ticks of the given axis.protected voidrenderLabel(WPainter painter, java.lang.CharSequence text, WPointF p, java.util.EnumSet<AlignmentFlag> flags, double angle, int margin)Utility function for rendering text.protected voidrenderLegend(WPainter painter)Renders the (default) legend and chart titles.voidrenderLegendIcon(WPainter painter, WPointF pos, WDataSeries series)Renders the legend icon for a given data series.voidrenderLegendItem(WPainter painter, WPointF pos, WDataSeries series)Renders the legend item for a given data series.protected voidrenderOther(WPainter painter)Renders other, user-defined things.protected voidrenderSeries(WPainter painter)Renders all series data, including value labels.Signal2<WDataSeries,WPointF>seriesSelected()A signal that notifies the selection of a new curve.voidsetAxis(WAxis waxis, Axis axis)Sets an axis.voidsetAxisPadding(int padding)Sets the padding between the chart area and the axes.voidsetBarMargin(double margin)Sets the margin between bars of different series.voidsetBorderPen(WPen pen)Sets the pen of the border to be drawn around the chart area.voidsetCrosshairColor(WColor color)Sets the crosshair color.voidsetCrosshairEnabled()Enables the crosshair functionality.voidsetCrosshairEnabled(boolean crosshair)Enables the crosshair functionality.voidsetCrosshairXAxis(int xAxis)Sets the X axis to use for the crosshair.voidsetCrosshairYAxis(int yAxis)Sets the Y axis to use for the crosshair.voidsetCurveLabels(java.util.List<CurveLabel> labels)Configure all curve labels at once.voidsetCurveManipulationEnabled()Enable curve manipulation.voidsetCurveManipulationEnabled(boolean enabled)Enable curve manipulation.voidsetFollowCurve(int followCurve)Deprecated.UsesetFollowCurve()insteadvoidsetFollowCurve(WDataSeries series)Enabled the follow curve funtionality for a data series.protected voidsetFormData(WObject.FormData formData)voidsetLegendColumns(int columns, WLength columnWidth)Configures multiple legend columns.voidsetLegendEnabled(boolean enabled)Enables the legend.voidsetLegendLocation(LegendLocation location, Side side, AlignmentFlag alignment)Configures the legend location.voidsetLegendStyle(WFont font, WPen border, WBrush background)Configures the legend decoration.voidsetLoadingBackground(WBrush brush)Set the background brush for the unloaded area.voidsetOnDemandLoadingEnabled(boolean enabled)Enable on-demand loading.voidsetOrientation(Orientation orientation)Sets the chart orientation.voidsetPanEnabled()Enables pan functionality.voidsetPanEnabled(boolean panEnabled)Enables pan functionality.voidsetRubberBandEffectEnabled()Enables/disables the inertial scrolling and rubberband effect.voidsetRubberBandEffectEnabled(boolean rubberBandEnabled)Enables/disables the inertial scrolling and rubberband effect.voidsetSelectedSeries(WDataSeries series)Sets the series that is currently selected.voidsetSeries(java.util.List<WDataSeries> series)Sets all data series.voidsetSeriesSelectionEnabled()Sets whether series selection is enabled.voidsetSeriesSelectionEnabled(boolean enabled)Sets whether series selection is enabled.voidsetSoftLabelClipping(boolean enabled)Enables or disables soft label clipping on all axes.voidsetTextPen(WPen pen)set the pen used to render the labelsvoidsetType(ChartType type)Sets the chart type.voidsetWheelActions(java.util.Map<java.util.EnumSet<KeyboardModifier>,InteractiveAction> wheelActions)Sets the mapping of mouse wheel actions for interactive charts.voidsetXSeriesColumn(int modelColumn)Sets the the model column for the X series.voidsetZoomEnabled()Enables zoom functionality.voidsetZoomEnabled(boolean zoomEnabled)Enables zoom functionality.intXSeriesColumn()Returns the model column for the X series.protected WTransformzoomRangeTransform()Returns the current zoom range transform.protected WTransformzoomRangeTransform(int yAxis)Returns the current zoom range transform.protected WTransformzoomRangeTransform(WAxis xAxis, WAxis yAxis)Returns the current zoom range transform.Methods inherited from class eu.webtoolkit.jwt.chart.WAbstractChart
getBackground, getItemModel, getModel, getPalette, getPlotAreaPadding, getTitle, getTitleFont, isAutoLayoutEnabled, paint, setAutoLayoutEnabled, setAutoLayoutEnabled, setBackground, setModel, setModel, setPalette, setPlotAreaPadding, setPlotAreaPadding, setPlotAreaPadding, setTitle, setTitleFontMethods inherited from class eu.webtoolkit.jwt.WPaintedWidget
addArea, createDomElement, createJSBrush, createJSPainterPath, createJSPen, createJSPoint, createJSRect, createJSTransform, enableAjax, getArea, getAreas, getCreatePaintDevice, getMethod, getObjJsRef, getPreferredMethod, getRepaintSlot, insertArea, layoutSizeChanged, removeArea, resize, setPreferredMethod, update, update, updateMethods inherited from class eu.webtoolkit.jwt.WInteractWidget
clicked, doubleClicked, enterPressed, escapePressed, gestureChanged, gestureEnded, gestureStarted, getMouseOverDelay, isEnabled, keyPressed, keyWentDown, keyWentUp, load, mouseDragged, mouseMoved, mouseWentDown, mouseWentOut, mouseWentOver, mouseWentUp, mouseWheel, propagateSetEnabled, setDraggable, setDraggable, setDraggable, setDraggable, setMouseOverDelay, setPopup, touchEnded, touchMoved, touchStarted, unsetDraggableMethods inherited from class eu.webtoolkit.jwt.WWebWidget
addStyleClass, blurred, callJavaScriptMember, childrenChanged, doJavaScript, escapeText, escapeText, escapeText, escapeText, find, findById, focussed, getAttributeValue, getBaseZIndex, getChildren, getClearSides, getDecorationStyle, getFloatSide, getHeight, getHtmlTagName, getId, getJavaScriptMember, getLineHeight, getMargin, getMaximumHeight, getMaximumWidth, getMinimumHeight, getMinimumWidth, getOffset, getPositionScheme, getScrollVisibilityMargin, getStyleClass, getTabIndex, getToolTip, getVerticalAlignment, getVerticalAlignmentLength, getWidth, hasFocus, hasStyleClass, isCanReceiveFocus, isDisabled, isHidden, isHiddenKeepsGeometry, isInline, isLoaded, isPopup, isRendered, isScrollVisibilityEnabled, isScrollVisible, isSetFirstFocus, isThemeStyleEnabled, isVisible, jsStringLiteral, jsStringLiteral, parentResized, parentResized, propagateSetVisible, refresh, removeScript, removeStyleClass, scrollVisibilityChanged, setAttributeValue, setBaseZIndex, setCanReceiveFocus, setClearSides, setDecorationStyle, setDeferredToolTip, setDisabled, setFloatSide, setFocus, setHidden, setHiddenKeepsGeometry, setHtmlTagName, setId, setInline, setJavaScriptMember, setLineHeight, setLoadLaterWhenInvisible, setMargin, setMaximumSize, setMinimumSize, setOffsets, setPositionScheme, setScrollVisibilityEnabled, setScrollVisibilityMargin, setSelectable, setStyleClass, setTabIndex, setThemeStyleEnabled, setToolTip, setVerticalAlignment, updateSignalConnection, voidEventSignalMethods inherited from class eu.webtoolkit.jwt.WWidget
acceptDrops, acceptDrops, addCssRule, addCssRule, addJSignal, addStyleClass, animateHide, animateShow, boxBorder, boxPadding, createJavaScript, disable, dropEvent, enable, getDropTouch, getJsRef, getParent, hide, htmlText, isExposed, isLayoutSizeAware, needsRerender, positionAt, positionAt, removeChild, removeStyleClass, render, resize, scheduleRender, scheduleRender, scheduleRender, setClearSides, setDeferredToolTip, setFocus, setHeight, setHidden, setLayoutSizeAware, setMargin, setMargin, setMargin, setMargin, setMargin, setObjectName, setOffsets, setOffsets, setOffsets, setOffsets, setOffsets, setToolTip, setVerticalAlignment, setWidth, show, stopAcceptDrops, toggleStyleClass, toggleStyleClass, trMethods inherited from class eu.webtoolkit.jwt.WObject
addChild, getObjectNameMethods inherited from class java.lang.Object
clone, equals, finalize, getClass, hashCode, notify, notifyAll, toString, wait, wait, wait
-
Constructor Details
-
WCartesianChart
Creates a new cartesian chart.Creates a cartesian chart of type
ChartType.CategoryChart. -
WCartesianChart
public WCartesianChart()Creates a new cartesian chart. -
WCartesianChart
Creates a new cartesian chart.Creates a cartesian chart of the indicated
type. -
WCartesianChart
Creates a new cartesian chart.
-
-
Method Details
-
remove
public void remove()Description copied from class:WAbstractChartDestructor.- Overrides:
removein classWAbstractChart- See Also:
WContainerWidget.removeWidget(WWidget widget)
-
setType
Sets the chart type.The chart type determines how (x,y) data are interpreted. In a
ChartType.CategoryChart, the X values are categories, and these are plotted consecutively, evenly spaced, and in row order. In aChartType.ScatterPlot, the X values are interpreted numerically (as for Y values).The default chart type is a
ChartType.CategoryChart. -
getType
Returns the chart type.- See Also:
setType(ChartType type)
-
setOrientation
Sets the chart orientation.Sets the chart orientation, which corresponds to the orientation of the Y axis: a
Orientation.Verticalorientation corresponds to the conventional way of a horizontal X axis and vertical Y axis. AOrientation.Horizontalorientation is the other way around.The default orientation is
Orientation.Vertical.- See Also:
getOrientation()
-
getOrientation
Returns the chart orientation.- See Also:
setOrientation(Orientation orientation)
-
setXSeriesColumn
public void setXSeriesColumn(int modelColumn)Sets the the model column for the X series.Use this method to specify the default data for the X series. For a
ChartType.ScatterPlotthis is mandatory if an X series is not specified for everyWDataSeries. For aChartType.CategoryChart, if not specified, an increasing series of integer numbers will be used (1, 2, ...).Scatterplot dataseries may each individually be given its own X series data using
WDataSeries#setXSeriesColumn()The default value is -1 (not specified).
The series column is reset to -1 when the model is set (or changed). Thus you need to set a model before configuring the series.
- See Also:
XSeriesColumn()
-
setTextPen
set the pen used to render the labelsThis method overwrites the pen for all axes
- See Also:
WAxis.setTextPen(WPen pen)
-
XSeriesColumn
public int XSeriesColumn()Returns the model column for the X series.- See Also:
setXSeriesColumn(int modelColumn)
-
addSeries
Adds a data series.A single chart may display one or more data series. Each data series displays data from a single model column in the chart. Series are plotted in the order that they have been added to the chart.
The series column is reset to -1 when the model is set (or changed). Thus you need to set a model before configuring the series.
-
removeSeries
public void removeSeries(int modelColumn)Deprecated.UseremoveSeries()insteadRemoves a data series.This removes the first data series which plots the given
modelColumn. -
removeSeries
Removes a data series.This will disassociate the given series from any WAxisSliderWidgets.
-
setSeries
Sets all data series.Replaces the current list of series with the new list.
Note: All series currently associated with the chart will be deleted. Hence, these series should be distinct from the currently associated series of this chart!
-
getSeries
Returns a data series corresponding to a data column.Returns a reference to the first data series that plots data from
modelColumn. -
getSeries
Returns a list with the current data series.Returns the complete list of current data series.
-
getAxis
Returns a chart axis.Returns a reference to the specified
axis. -
setAxis
Sets an axis.- See Also:
getAxis(Axis axis)
-
getXAxes
Returns a vector of all X axes associated with this chart.This defaults to a vector of one axis.
-
getYAxes
Returns a vector of all Y axes associated with this chart.This defaults to a vector of two axes: the Y1 and Y2 axes. Y1 will be at index 0, and Y2 will be at index 1.
-
getXAxisCount
public int getXAxisCount()Returns the number of X axes associated with this chart. -
getYAxisCount
public int getYAxisCount()Returns the number of Y axes associated with this chart. -
getXAxis
Retrieves the X axis at index i.The following expression is always true:
getAxis(Axis.XAxis) == getXAxis(0)Note: Precondition: 0 <= i <
getXAxisCount() -
getYAxis
Retrieves the Y axis at index i.The following expressions are always true:
 getAxis(Axis.YAxis) == getYAxis(0)
 getAxis(Axis.Y2Axis) == getYAxis(1)
Note: Precondition: 0 <= i <
getYAxisCount() -
addXAxis
Adds a X axis to this chart.The first extra axis will have index 1, the next index 2,...
Returns the index of the added axis.
Note: This transfers ownership of the given
WAxisto this chart.Note: Precondition: waxis is not null
-
addYAxis
Adds a Y axis to this chart.The first extra axis will have index 2, the next index 3,...
Returns the index of the added axis.
Note: This transfers ownership of the given
WAxisto this chart.Note: Precondition: waxis is not null
-
removeXAxis
public void removeXAxis(int xAxisId)Removes the X axis with the given id.The indices of the axes with an id higher than xAxisId will be decremented.
Any
WDataSeriesassociated with the removed axis are also removed.Note: Precondition: 0 <= xAxisId <
getXAxisCount() -
removeYAxis
public void removeYAxis(int yAxisId)Removes the Y axis with the given id.The indices of the axes with an id higher than yAxisId will be decremented.
Any
WDataSeriesassociated with the removed axis are also removed.Note: Precondition: 0 <= yAxisId <
getYAxisCount() -
clearXAxes
public void clearXAxes()Clears all X axes.The effect is the same as repeatedly using
removeYAxis()until are axes are removed, i.e. anyWDataSerieswill also be removed. -
clearYAxes
public void clearYAxes()Clears all Y axes.The effect is the same as repeatedly using
removeYAxis()until are axes are removed, i.e. anyWDataSerieswill also be removed. -
setBarMargin
public void setBarMargin(double margin)Sets the margin between bars of different series.Use this method to change the margin that is set between bars of different series. The margin is specified as a fraction of the width. For example, a value of 0.1 adds a 10% margin between bars of each series. Negative values are also allowed. For example, use a margin of -1 to plot the bars of different series on top of each other.
The default value is 0.
-
getBarMargin
public double getBarMargin()Returns the margin between bars of different series.- See Also:
setBarMargin(double margin)
-
setLegendEnabled
public void setLegendEnabled(boolean enabled)Enables the legend.The location of the legend can be configured using
setLegendLocation(). Only series for which the legend is enabled are included in this legend.The default value is
false. -
isLegendEnabled
public boolean isLegendEnabled()Returns whether the legend is enabled.- See Also:
setLegendEnabled(boolean enabled)
-
setLegendLocation
Configures the legend location.The legend can be renderd either inside or outside of the chart area. When
locationisLegendLocation.LegendInside, the legend will be rendered inside the chart. WhenlocationisChart::Legendoutside, the legend is rendered outside the chart, in the chart padding area.The provided
sidecan either beSide.Left,Side.Right,Side.Top,Side.Bottomand configures the side of the chart at which the legend is displayed.The
alignmentspecifies how the legend is aligned. This can be a horizontal alignment flag (AlignmentFlag.AlignLeft,AlignmentFlag.AlignCenter, orAlignmentFlag.AlignRight), when thesideis Bottom or Top, or a vertical alignment flag (AlignmentFlag.AlignTop,AlignmentFlag.AlignMiddle, orAlignmentFlag.AlignBottom) when thesideis Left or Right.The default location is
LegendLocation.LegendOutside,Side.RightandAlignmentFlag.AlignMiddle.To have more control over the legend, you could reimplement the
renderLegendItem()method to customize how one item in the legend is rendered, or, alternatively you can disable the legend generated by the chart itself, and reimplement thepaint()method in which you use therenderLegendItem()method repeatedly to render a customized legend. -
setLegendStyle
Configures the legend decoration.This configures the font, border and background for the legend.
The default font is a 10pt sans serif font (the same as the default axis label font), the default
borderisPenStyle.NoPenand the defaultbackgroundisBrushStyle.NoBrush.- See Also:
setLegendEnabled(boolean enabled)
-
getLegendLocation
Returns the legend location. -
getLegendSide
Returns the legend side. -
getLegendAlignment
Returns the legend alignment. -
getLegendColumns
public int getLegendColumns()Returns the legend columns. -
getLegendColumnWidth
Returns the legend column width. -
getLegendFont
Returns the legend font. -
getLegendBorder
Returns the legend border pen. -
getLegendBackground
Returns the legend background brush. -
setLegendColumns
Configures multiple legend columns.Multiple columns are typically useful when placing the legend at the top or at the bottom of the chart.
The default value is a single column, 100 pixels wide.
When automatic chart layout is enabled, then the legend column width is computed automatically, and this setting is ignored.
-
paint
Description copied from class:WAbstractChartPaint the chart in a rectangle of the given painter.Paints the chart inside the painter, in the area indicated by rectangle. When rectangle is a null rectangle, the entire painter
WPainter.getWindow()is used.- Specified by:
paintin classWAbstractChart
-
drawMarker
Draws the marker for a given data series.Draws the marker for the indicated
seriesin theresult. This method is called while painting the chart, and you may want to reimplement this method if you wish to provide a custom marker for a particular data series.- See Also:
setLegendEnabled(boolean enabled)
-
renderLegendIcon
Renders the legend icon for a given data series.Renders the legend icon for the indicated
seriesin thepainterat positionpos.This method is called while rendering a legend item, and you may want to reimplement this method if you wish to provide a custom legend icon for a particular data series.
-
renderLegendItem
Renders the legend item for a given data series.Renders the legend item for the indicated
seriesin thepainterat positionpos. The default implementation draws the marker, and the series description to the right. The series description is taken from the model's header data for that series' data column.This method is called while painting the chart, and you may want to reimplement this method if you wish to provide a custom marker for a particular data series.
- See Also:
setLegendEnabled(boolean enabled)
-
mapFromDevice
Maps from device coordinates to model coordinates.Maps a position in the chart back to model coordinates.
This uses the axis dimensions that are based on the latest chart rendering. If you have not yet rendered the chart, or wish that the mapping already reflects model changes since the last rendering, you should call
initLayout()first.If the chart is interactive, mapFromDevice will correctly take the current zoom range into account.
-
mapFromDevice
Maps from device coordinates to model coordinates. -
mapFromDevice
Maps from device coordinates to model coordinates.Maps a position in the chart back to model coordinates.
This uses the axis dimensions that are based on the latest chart rendering. If you have not yet rendered the chart, or wish that the mapping already reflects model changes since the last rendering, you should call
initLayout()first.If the chart is interactive, mapFromDevice will correctly take the current zoom range into account.
-
mapFromDeviceWithoutTransform
Maps from device coordinates to model coordinates, ignoring the current zoom range.Maps a position in the chart back to model coordinates, as if the chart was not zoomed in (nor panned).
This uses the axis dimensions that are based on the latest chart rendering. If you have not yet rendered the chart, or wish that the mapping already reflects model changes since the last rendering, you should call
initLayout()first.This function will not take the current zoom range into account. The mapping will be performed as if
zoomRangeTransform()is the identity transform. -
mapFromDeviceWithoutTransform
Maps from device coordinates to model coordinates, ignoring the current zoom range.Returns
mapFromDeviceWithoutTransform(point, Axis.OrdinateAxis) -
mapFromDevice
Maps from device coordinates to model coordinates.Maps a position in the chart back to model coordinates.
This uses the axis dimensions that are based on the latest chart rendering. If you have not yet rendered the chart, or wish that the mapping already reflects model changes since the last rendering, you should call
initLayout()first.If the chart is interactive, mapFromDevice will correctly take the current zoom range into account.
-
mapFromDeviceWithoutTransform
Maps from device coordinates to model coordinates, ignoring the current zoom range.Maps a position in the chart back to model coordinates, as if the chart was not zoomed in (nor panned).
This uses the axis dimensions that are based on the latest chart rendering. If you have not yet rendered the chart, or wish that the mapping already reflects model changes since the last rendering, you should call
initLayout()first.This function will not take the current zoom range into account. The mapping will be performed as if
zoomRangeTransform()is the identity transform. -
mapFromDeviceWithoutTransform
Maps from device coordinates to model coordinates, ignoring the current zoom range.Maps a position in the chart back to model coordinates, as if the chart was not zoomed in (nor panned).
This uses the axis dimensions that are based on the latest chart rendering. If you have not yet rendered the chart, or wish that the mapping already reflects model changes since the last rendering, you should call
initLayout()first.This function will not take the current zoom range into account. The mapping will be performed as if
zoomRangeTransform()is the identity transform. -
mapToDevice
public WPointF mapToDevice(java.lang.Object xValue, java.lang.Object yValue, Axis axis, int xSegment, int ySegment)Maps model values onto chart coordinates.This returns the chart device coordinates for a (x,y) pair of model values.
This uses the axis dimensions that are based on the latest chart rendering. If you have not yet rendered the chart, or wish that the mapping already reflects model changes since the last rendering, you should call
initLayout()first.The
xSegmentandySegmentarguments are relevant only when the corresponding axis is broken usingWAxis#setBreak(). Then, its possible values may be 0 (below the break) or 1 (above the break).If the chart is interactive, mapToDevice will correctly take the current zoom range into account.
-
mapToDevice
Maps model values onto chart coordinates.Returns
mapToDevice(xValue, yValue, Axis.OrdinateAxis, 0, 0) -
mapToDevice
Maps model values onto chart coordinates. -
mapToDevice
public final WPointF mapToDevice(java.lang.Object xValue, java.lang.Object yValue, Axis axis, int xSegment)Maps model values onto chart coordinates. -
mapToDevice
public WPointF mapToDevice(java.lang.Object xValue, java.lang.Object yValue, int axis, int xSegment, int ySegment)Maps model values onto chart coordinates.This returns the chart device coordinates for a (x,y) pair of model values.
This uses the axis dimensions that are based on the latest chart rendering. If you have not yet rendered the chart, or wish that the mapping already reflects model changes since the last rendering, you should call
initLayout()first.The
xSegmentandySegmentarguments are relevant only when the corresponding axis is broken usingWAxis#setBreak(). Then, its possible values may be 0 (below the break) or 1 (above the break).If the chart is interactive, mapToDevice will correctly take the current zoom range into account.
-
mapToDevice
Maps model values onto chart coordinates. -
mapToDevice
public final WPointF mapToDevice(java.lang.Object xValue, java.lang.Object yValue, int axis, int xSegment)Maps model values onto chart coordinates. -
mapToDevice
public WPointF mapToDevice(java.lang.Object xValue, java.lang.Object yValue, WAxis xAxis, WAxis yAxis, int xSegment, int ySegment)Maps model values onto chart coordinates.This returns the chart device coordinates for a (x,y) pair of model values.
This uses the axis dimensions that are based on the latest chart rendering. If you have not yet rendered the chart, or wish that the mapping already reflects model changes since the last rendering, you should call
initLayout()first.The
xSegmentandySegmentarguments are relevant only when the corresponding axis is broken usingWAxis#setBreak(). Then, its possible values may be 0 (below the break) or 1 (above the break).If the chart is interactive, mapToDevice will correctly take the current zoom range into account.
-
mapToDevice
public final WPointF mapToDevice(java.lang.Object xValue, java.lang.Object yValue, WAxis xAxis, WAxis yAxis)Maps model values onto chart coordinates. -
mapToDevice
public final WPointF mapToDevice(java.lang.Object xValue, java.lang.Object yValue, WAxis xAxis, WAxis yAxis, int xSegment)Maps model values onto chart coordinates.Returns
mapToDevice(xValue, yValue, xAxis, yAxis, xSegment, 0) -
mapToDeviceWithoutTransform
public WPointF mapToDeviceWithoutTransform(java.lang.Object xValue, java.lang.Object yValue, Axis ordinateAxis, int xSegment, int ySegment)Maps model values onto chart coordinates, ignoring the current zoom range.This returns the chart device coordinates for a (x,y) pair of model values.
This uses the axis dimensions that are based on the latest chart rendering. If you have not yet rendered the chart, or wish that the mapping already reflects model changes since the last rendering, you should call
initLayout()first.The
xSegmentandySegmentarguments are relevant only when the corresponding axis is broken usingWAxis#setBreak(). Then, its possible values may be 0 (below the break) or 1 (above the break).This function will not take the current zoom range into account.The mapping will be performed as if
zoomRangeTransform()is the identity transform. -
mapToDeviceWithoutTransform
Maps model values onto chart coordinates, ignoring the current zoom range.Returns
mapToDeviceWithoutTransform(xValue, yValue, Axis.OrdinateAxis, 0, 0) -
mapToDeviceWithoutTransform
public final WPointF mapToDeviceWithoutTransform(java.lang.Object xValue, java.lang.Object yValue, Axis ordinateAxis)Maps model values onto chart coordinates, ignoring the current zoom range.Returns
mapToDeviceWithoutTransform(xValue, yValue, ordinateAxis, 0, 0) -
mapToDeviceWithoutTransform
public final WPointF mapToDeviceWithoutTransform(java.lang.Object xValue, java.lang.Object yValue, Axis ordinateAxis, int xSegment)Maps model values onto chart coordinates, ignoring the current zoom range.Returns
mapToDeviceWithoutTransform(xValue, yValue, ordinateAxis, xSegment, 0) -
mapToDeviceWithoutTransform
public WPointF mapToDeviceWithoutTransform(java.lang.Object xValue, java.lang.Object yValue, int ordinateAxis, int xSegment, int ySegment)Maps model values onto chart coordinates, ignoring the current zoom range.This returns the chart device coordinates for a (x,y) pair of model values.
This uses the axis dimensions that are based on the latest chart rendering. If you have not yet rendered the chart, or wish that the mapping already reflects model changes since the last rendering, you should call
initLayout()first.The
xSegmentandySegmentarguments are relevant only when the corresponding axis is broken usingWAxis#setBreak(). Then, its possible values may be 0 (below the break) or 1 (above the break).This function will not take the current zoom range into account.The mapping will be performed as if
zoomRangeTransform()is the identity transform. -
mapToDeviceWithoutTransform
public final WPointF mapToDeviceWithoutTransform(java.lang.Object xValue, java.lang.Object yValue, int ordinateAxis)Maps model values onto chart coordinates, ignoring the current zoom range.Returns
mapToDeviceWithoutTransform(xValue, yValue, ordinateAxis, 0, 0) -
mapToDeviceWithoutTransform
public final WPointF mapToDeviceWithoutTransform(java.lang.Object xValue, java.lang.Object yValue, int ordinateAxis, int xSegment)Maps model values onto chart coordinates, ignoring the current zoom range.Returns
mapToDeviceWithoutTransform(xValue, yValue, ordinateAxis, xSegment, 0) -
mapToDeviceWithoutTransform
public WPointF mapToDeviceWithoutTransform(java.lang.Object xValue, java.lang.Object yValue, WAxis xAxis, WAxis yAxis, int xSegment, int ySegment)Maps model values onto chart coordinates, ignoring the current zoom range.This returns the chart device coordinates for a (x,y) pair of model values.
This uses the axis dimensions that are based on the latest chart rendering. If you have not yet rendered the chart, or wish that the mapping already reflects model changes since the last rendering, you should call
initLayout()first.The
xSegmentandySegmentarguments are relevant only when the corresponding axis is broken usingWAxis#setBreak(). Then, its possible values may be 0 (below the break) or 1 (above the break).This function will not take the current zoom range into account.The mapping will be performed as if
zoomRangeTransform()is the identity transform. -
mapToDeviceWithoutTransform
public final WPointF mapToDeviceWithoutTransform(java.lang.Object xValue, java.lang.Object yValue, WAxis xAxis, WAxis yAxis)Maps model values onto chart coordinates, ignoring the current zoom range.Returns
mapToDeviceWithoutTransform(xValue, yValue, xAxis, yAxis, 0, 0) -
mapToDeviceWithoutTransform
public final WPointF mapToDeviceWithoutTransform(java.lang.Object xValue, java.lang.Object yValue, WAxis xAxis, WAxis yAxis, int xSegment)Maps model values onto chart coordinates, ignoring the current zoom range.Returns
mapToDeviceWithoutTransform(xValue, yValue, xAxis, yAxis, xSegment, 0) -
initLayout
Initializes the chart layout.The mapping between model and device coordinates is only established after a rendering phase, or after calling initLayout manually.
You need a layout in order to use the
mapFromDevice()andmapToDevice()methods.Unless a specific chart rectangle is specified, the entire widget area is assumed.
-
initLayout
public final boolean initLayout()Initializes the chart layout. -
initLayout
Initializes the chart layout. -
createLegendItemWidget
Creates a widget which renders the a legend item.The legend item widget will contain a text and a
WPaintedWidgetwhich draws the series' symbol. -
addDataPointArea
Adds a data point area (used for displaying e.g. tooltips).You may want to specialize this is if you wish to modify (or delete) the area.
Note: Currently, an area is only created if the
ItemDataRole.ToolTipRoledata at the data point is not empty. -
setAxisPadding
public void setAxisPadding(int padding)Sets the padding between the chart area and the axes.This calls WAxes::setPadding() on all axes.
- See Also:
getAxisPadding()
-
getAxisPadding
public int getAxisPadding()Returns the padding between the chart area and the axes.This number may not reflect the actual padding of the individual axes, if another padding has been applied on the individual axes.
- See Also:
setAxisPadding(int padding)
-
setBorderPen
Sets the pen of the border to be drawn around the chart area.- See Also:
getBorderPen()
-
getBorderPen
Returns the pen used to draw the border around the chart area.Defaults to NoPen.
- See Also:
setBorderPen(WPen pen)
-
addCurveLabel
Add a curve label. -
setCurveLabels
Configure all curve labels at once.- See Also:
addCurveLabel(CurveLabel label)
-
clearCurveLabels
public void clearCurveLabels()Clear all curve labels.- See Also:
addCurveLabel(CurveLabel label)
-
getCurveLabels
Get all of the registered curve labels.- See Also:
setCurveLabels(List labels)
-
setZoomEnabled
public void setZoomEnabled(boolean zoomEnabled)Enables zoom functionality.When using the mouse, press the ctrl key while scrolling to zoom in/out a specific point on the chart. If you press shift+ctrl, it will only zoom vertically. If you press alt+ctrl, it will only zoom horizontally. To change these default mappings, use
setWheelActions().When using touch, you can use a pinch gesture to zoom in/out. If the pinch gesture is vertical/horizontal, it will zoom only vertically/horizontally, otherwise it will zoom both axes equally.
The default value is
false.- See Also:
isZoomEnabled(),setWheelActions(Map wheelActions)
-
setZoomEnabled
public final void setZoomEnabled()Enables zoom functionality.Calls
setZoomEnabled(true) -
isZoomEnabled
public boolean isZoomEnabled()Returns whether zoom is enabled.- See Also:
setZoomEnabled(boolean zoomEnabled)
-
setPanEnabled
public void setPanEnabled(boolean panEnabled)Enables pan functionality.When using the mouse, you can click and drag to pan the chart (if zoomed in), or use the scrollwheel.
When using touch, you can drag to pan the chart. If the rubberband effect is enabled, this is intertial (it will keep scrolling after you let go) and there is an overscroll and bounce back effect on the sides.
The default value is
false.- See Also:
isPanEnabled()
-
setPanEnabled
public final void setPanEnabled()Enables pan functionality.Calls
setPanEnabled(true) -
isPanEnabled
public boolean isPanEnabled()Returns whether pan is enabled.- See Also:
setPanEnabled(boolean panEnabled)
-
setCrosshairEnabled
public void setCrosshairEnabled(boolean crosshair)Enables the crosshair functionality.When enabled, the crosshair will follow mouse movement, and show in the top right corner the coordinate (according to X axis and the first Y axis) corresponding to this position.
When using touch, the crosshair can be moved with a drag. If both panning and the crosshair are enabled, the crosshair will be moved when dragging close to the crosshair. Otherwise, the chart will pan.
-
setCrosshairEnabled
public final void setCrosshairEnabled()Enables the crosshair functionality. -
isCrosshairEnabled
public boolean isCrosshairEnabled()Returns whether the crosshair is enabled.- See Also:
setCrosshairEnabled(boolean crosshair)
-
setCrosshairColor
Sets the crosshair color.The crosshair color is black by default.
- See Also:
setCrosshairEnabled(boolean crosshair)
-
getCrosshairColor
Returns the crosshair color. -
setCrosshairXAxis
public void setCrosshairXAxis(int xAxis)Sets the X axis to use for the crosshair.Defaults to 0 (first X axis)
-
getCrosshairXAxis
public int getCrosshairXAxis()Returns the X axis to use for the crosshair. -
setCrosshairYAxis
public void setCrosshairYAxis(int yAxis)Sets the Y axis to use for the crosshair.Defaults to 0 (first Y axis)
-
getCrosshairYAxis
public int getCrosshairYAxis()Returns the Y axis to use for the crosshair. -
setFollowCurve
public void setFollowCurve(int followCurve)Deprecated.UsesetFollowCurve()insteadEnables the follow curve functionality for a data series.This enables follow curve functionality for the data series corresponding to the given column.
If the data series is of type LineSeries or CurveSeries, the crosshair can only be moved in the x direction. The y position of the crosshair will be determined by the value of the data series. The crosshair will snap to the nearest point that is defined in the data series.
When using the mouse, the x position will change on mouseover. When using touch, the x position can be moved with a drag. The follow curve functionality has priority over the crosshair functionality.
Use column index -1 or
disableFollowCurve()to disable the follow curve feature.Note: The follow curve functionality requires that the X axis values of the data series are monotonically increasing or decreasing.
-
setFollowCurve
Enabled the follow curve funtionality for a data series.This enables follow curve functionality for the data series corresponding to the given column.
If the data series is of type LineSeries or CurveSeries, the crosshair can only be moved in the x direction. The y position of the crosshair will be determined by the value of the data series. The crosshair will snap to the nearest point that is defined in the data series.
When using the mouse, the x position will change on mouseover. When using touch, the x position can be moved with a drag. The follow curve functionality has priority over the crosshair functionality.
Set to null to disable the follow curve feature.
Note: The follow curve functionality requires that the X axis values of the data series are monotonically increasing or decreasing.
-
disableFollowCurve
public void disableFollowCurve()Disable the follow curve functionality.- See Also:
setFollowCurve(int followCurve)
-
getFollowCurve
Returns the curve that is to be followed.If follow curve functionality is not enabled, returns -1.
- See Also:
setFollowCurve(int followCurve)
-
setRubberBandEffectEnabled
public void setRubberBandEffectEnabled(boolean rubberBandEnabled)Enables/disables the inertial scrolling and rubberband effect.- See Also:
setPanEnabled(boolean panEnabled)
-
setRubberBandEffectEnabled
public final void setRubberBandEffectEnabled()Enables/disables the inertial scrolling and rubberband effect. -
isRubberBandEffectEnabled
public boolean isRubberBandEffectEnabled()Checks whether the rubberband effect is enabled. -
setWheelActions
public void setWheelActions(java.util.Map<java.util.EnumSet<KeyboardModifier>,InteractiveAction> wheelActions)Sets the mapping of mouse wheel actions for interactive charts.- See Also:
getWheelActions()
-
getWheelActions
Returns the current mouse wheel actions for interactive charts.- See Also:
setWheelActions(Map wheelActions)
-
setSoftLabelClipping
public void setSoftLabelClipping(boolean enabled)Enables or disables soft label clipping on all axes. -
setSeriesSelectionEnabled
public void setSeriesSelectionEnabled(boolean enabled)Sets whether series selection is enabled.If series selection is enabled, series can be selected with a mouse click or long press. If the selected series is a LineSeries or CurveSeries, it can be manipulated if
curve manipulationis enabled. The series that are not selected, will be shown in a lighter color. -
setSeriesSelectionEnabled
public final void setSeriesSelectionEnabled()Sets whether series selection is enabled. -
isSeriesSelectionEnabled
public boolean isSeriesSelectionEnabled()Returns whether series selection is enabled. -
seriesSelected
A signal that notifies the selection of a new curve.This signal is emitted if a series is selected using a mouse click or long press. The first argument is the selected series. The second argument is the point that was selected, in model coordinates.
-
setSelectedSeries
Sets the series that is currently selected.The series with the given model column will be selected. The other series will be shown in a lighter color. The series that is currently selected is the one that can be manipulated if
curve manipulationis enabled, and it is a LineSeries or CurveSeries.The selected series can be changed using a long touch or mouse click.
If the argument provided is null or
series selectionis not enabled, no series will be selected. -
getSelectedSeries
Get the currently selected curve.-1 means that no curve is currently selected.
- See Also:
setSelectedSeries(WDataSeries series)
-
setCurveManipulationEnabled
public void setCurveManipulationEnabled(boolean enabled)Enable curve manipulation.If curve manipulation is enabled, the
scaleandoffsetof theselected curvecan be manipulated interactively using drag, scroll, and pinch. -
setCurveManipulationEnabled
public final void setCurveManipulationEnabled()Enable curve manipulation. -
isCurveManipulationEnabled
public boolean isCurveManipulationEnabled()Returns whether curve manipulation is enabled. -
setOnDemandLoadingEnabled
public void setOnDemandLoadingEnabled(boolean enabled)Enable on-demand loading.By default, when on-demand loading is not enabled, the entire chart area is loaded, regardless of whether it is within the current zoom range of the X axis.
When on-demand loading is enabled only the currently visible area + some margin is loaded. As the visible area changes, different data is loaded. This improves performance for charts with a lot of data if not all of the data needs to be visible at the same time.
This feature is especially useful in combination with
WAxis#setMaximumZoomRange()orWAxis#setMinZoom(), which makes it impossible for the user to view all of the data at the same time, because that would incur too much overhead.Note: On-demand loading requires that the X axis data for all data series is sorted in ascending order. This feature is optimized for equidistant X axis data, but that's not a requirement.
Note: If no minimum or maximum are set on the Y axis (or axes), then the chart will still have to scan all data of its data series to automatically determine the minimum and maximum Y axis values. If this performance hit is undesirable and the Y axis range is known or guaranteed to be within a certain range, make sure to
set a rangeon the Y axis (or axes).- See Also:
isOnDemandLoadingEnabled()
-
isOnDemandLoadingEnabled
public boolean isOnDemandLoadingEnabled()Returns whether on-demand loading is enabled. -
setLoadingBackground
Set the background brush for the unloaded area. -
getLoadingBackground
Returns the background brush for the unloaded area. -
iterateSeries
public void iterateSeries(SeriesIterator iterator, WPainter painter, boolean reverseStacked, boolean extremesOnly) -
iterateSeries
-
iterateSeries
-
getDomChanges
Description copied from class:WWebWidgetGet DOM changes for this widget.This is an internal function, and should not be called directly, or be overridden!
- Overrides:
getDomChangesin classWPaintedWidget
-
modelChanged
protected void modelChanged()- Overrides:
modelChangedin classWAbstractChart
-
modelReset
protected void modelReset()- Overrides:
modelResetin classWAbstractChart
-
paintEvent
Paints the widget.This calls
render()to paint on the paint device.- Specified by:
paintEventin classWPaintedWidget
-
render
Renders the chart.Renders the chart within the given rectangle. To accomodate both rendering of horizontal and vertically oriented charts, all rendering logic assumes horizontal. This "chart coordinates" space is transformed to painter coordinates using
hv(). -
map
protected WPointF map(double xValue, double yValue, Axis yAxis, int currentXSegment, int currentYSegment)Map (x, y) value pair to chart coordinates coordinates.The result needs further transformation using
hv()to painter coordinates. -
map
Map (x, y) value pair to chart coordinates coordinates. -
map
Map (x, y) value pair to chart coordinates coordinates.Returns
map(xValue, yValue, yAxis, 0, 0) -
map
Map (x, y) value pair to chart coordinates coordinates. -
map
protected WPointF map(double xValue, double yValue, int yAxis, int currentXSegment, int currentYSegment)Map (x, y) value pair to chart coordinates coordinates.The result needs further transformation using
hv()to painter coordinates. -
map
Map (x, y) value pair to chart coordinates coordinates.Returns
map(xValue, yValue, yAxis, 0, 0) -
map
Map (x, y) value pair to chart coordinates coordinates. -
map
protected WPointF map(double xValue, double yValue, WAxis xAxis, WAxis yAxis, int currentXSegment, int currentYSegment)Map (x, y) value pair to chart coordinates coordinates.The result needs further transformation using
hv()to painter coordinates. -
map
Map (x, y) value pair to chart coordinates coordinates. -
map
protected final WPointF map(double xValue, double yValue, WAxis xAxis, WAxis yAxis, int currentXSegment)Map (x, y) value pair to chart coordinates coordinates.Returns
map(xValue, yValue, xAxis, yAxis, currentXSegment, 0) -
renderLabel
protected void renderLabel(WPainter painter, java.lang.CharSequence text, WPointF p, java.util.EnumSet<AlignmentFlag> flags, double angle, int margin)Utility function for rendering text.This method renders text on the chart position pos, with a particular alignment flags. These are both specified in chart coordinates. The position is converted to painter coordinates using
hv(), and the alignment flags are changed accordingly. The rotation, indicated by angle is specified in painter coordinates and thus an angle of 0 always indicates horizontal text, regardless of the chart orientation. -
hv
Conversion between chart and painter coordinates.Converts from chart coordinates to painter coordinates, taking into account the chart orientation.
-
hv
Conversion between chart and painter coordinates.Converts from chart coordinates to painter coordinates, taking into account the chart orientation.
-
hv
Conversion between chart and painter coordinates.Converts from chart coordinates to painter coordinates, taking into account the chart orientation.
-
chartSegmentArea
Returns the segment area for a combination of X and Y segments.This segment area is used for clipping when rendering in a particular segment.
-
chartSegmentArea
Returns the segment area for a combination of X and Y segments.This segment area is used for clipping when rendering in a particular segment.
-
calcChartArea
protected void calcChartArea()Calculates the chart area.This calculates the chartArea(), which is the rectangle (in chart coordinates) that bounds the actual chart (thus excluding axes, labels, titles, legend, etc...).
-
prepareAxes
Prepares the axes for rendering.Computes axis properties such as the range (if not manually specified), label interval (if not manually specified) and axis locations. These properties are stored within the axes.
-
renderBackground
Renders the background. -
renderAxes
Renders one or more properties of the axes.This calls
renderAxis()for each axis. -
renderAxes
protected final void renderAxes(WPainter painter, AxisProperty propertie, AxisProperty... properties)Renders one or more properties of the axes.Calls
renderAxes(painter, EnumSet.of(propertie, properties)) -
renderBorder
Renders the border of the chart area. -
renderCurveLabels
Renders the curve labels. -
renderSeries
Renders all series data, including value labels. -
renderLegend
Renders the (default) legend and chart titles. -
renderAxis
protected void renderAxis(WPainter painter, WAxis axis, java.util.EnumSet<AxisProperty> properties)Renders properties of one axis. -
renderAxis
protected final void renderAxis(WPainter painter, WAxis axis, AxisProperty propertie, AxisProperty... properties)Renders properties of one axis.Calls
renderAxis(painter, axis, EnumSet.of(propertie, properties)) -
renderGrid
Renders grid lines along the ticks of the given axis. -
renderOther
Renders other, user-defined things.The default implementation sets the painter's
clip pathto the chart area, but does not enable clipping.This method can be overridden to draw extra content onto the chart.
Chart coordinates can be mapped to device coordinates with
mapToDeviceWithoutTransform(). If these need to move and scale along with the zoom range, those points can be transformed withzoomRangeTransform().This method is called last by default. If you want to render other things at some other moment, you can override render(WPainter&, const WRectF&).
-
getCalcNumBarGroups
protected int getCalcNumBarGroups()Calculates the total number of bar groups. -
render
Description copied from class:WWidgetRenders the widget.This function renders the widget (or an update for the widget), after this has been scheduled using
scheduleRender().The default implementation will render the widget by serializing changes to JavaScript and HTML. You may want to reimplement this widget if you have been postponing some of the layout / rendering implementation until the latest moment possible. In that case you should make sure you call the base implementation however.
- Overrides:
renderin classWPaintedWidget
-
setFormData
- Overrides:
setFormDatain classWPaintedWidget
-
zoomRangeTransform
Returns the current zoom range transform.This transform maps device coordinates from the fully zoomed out position to the current zoom range.
This transform is a
JavaScript boundtransform if this chart is interactive. Otherwise, this transform is just the identity transform. -
zoomRangeTransform
Returns the current zoom range transform.Returns
zoomRangeTransform(0) -
zoomRangeTransform
Returns the current zoom range transform.This transform maps device coordinates from the fully zoomed out position to the current zoom range.
This transform is a
JavaScript boundtransform if this chart is interactive. Otherwise, this transform is just the identity transform.
-
removeSeries()instead