Class WCartesian3DChart
The chart consists of a plotcube, which is always open on the front, and adapts to the data
which is shown on the chart. The plotcube has three axes of type WAxis. Each of these can
be manually configured as in the 2D case. The chart can be either a ChartType.Scatter or
a ChartType.Category. This influences how the data is positioned in relation to the
x/y-axis. Gridlines can also be drawn on each of the plotcube-planes. The chart has a
mouse-handler which allows rotation of the chart around the center of the plotcube. Zooming in
and out is possible by scrolling.
Data that can be shown on the chart derives from WAbstractDataSeries3D. Multiple
dataseries can be added to the chart using addDataSeries(). The color of
the dataseries is by default determined by the colors of the WChartPalette. This way a
separate color is assigned to each new dataseries. All rendering logic of the data is contained
in the dataseries-classes and further styling is often possible there. For example, a WAbstractColorMap can be added to a dataseries, which will assign a color to datapoints based on
their z-value. More information on this is found in the documentation of WAbstractDataSeries3D.
It is possible to assign a title to the chart. A legend can also be shown that lists the titles of all dataseries (unless disabled in the dataseries itself). The legend position and style can be configured. In addition to title and legend, a colormap-legend is shown for every dataseries which has a colormap enabled and indicates that it should be displayed on the chart.
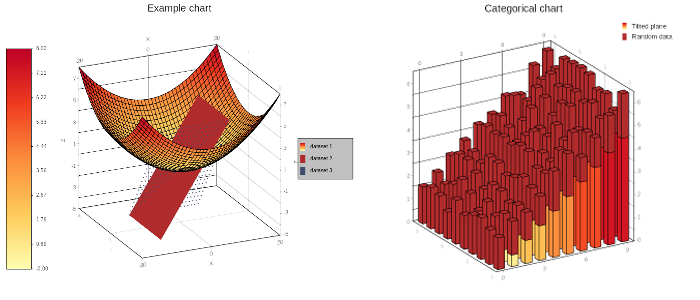
A scatterplot on the left, a category-chart on the right.
-
Nested Class Summary
Nested ClassesModifier and TypeClassDescriptionstatic classAn invisible intersection plane.Nested classes/interfaces inherited from class eu.webtoolkit.jwt.WGLWidget
WGLWidget.ArrayBuffer, WGLWidget.AttribLocation, WGLWidget.Buffer, WGLWidget.Framebuffer, WGLWidget.GLenum, WGLWidget.GlObject, WGLWidget.JavaScriptMatrix4x4, WGLWidget.JavaScriptVector, WGLWidget.Program, WGLWidget.Renderbuffer, WGLWidget.Shader, WGLWidget.Texture, WGLWidget.UniformLocationNested classes/interfaces inherited from class eu.webtoolkit.jwt.WObject
WObject.FormData -
Field Summary
Fields inherited from class eu.webtoolkit.jwt.WInteractWidget
dragTouchEndSlot_, dragTouchSlot_, noDefault -
Constructor Summary
ConstructorsConstructorDescriptionConstructor.WCartesian3DChart(ChartType type) Constructor.WCartesian3DChart(ChartType type, WContainerWidget parentContainer) Constructor.WCartesian3DChart(WContainerWidget parentContainer) Constructor. -
Method Summary
Modifier and TypeMethodDescriptionvoidaddDataSeries(WAbstractDataSeries3D dataseries_) Add a dataseries to the chart.Returns the specified axis belonging to the chart.voidcreateRay(double x, double y, javax.vecmath.GVector eye, javax.vecmath.GVector direction) Returns the background color used for this chart.javax.vecmath.Matrix4fGet the current camera-matrix.Returns a reference to the pen used for drawing the edges of the plotcube.Returns all dataseries that were added to this chart.Returns the pen used for drawing the gridlines.Gets the color of the intersection lines between surface charts.Get the invisible planes with which intersections are drawn.Get the current camera matrix as a JavaScriptMatrix4x4.Returns the legend alignment.Returns the legend background brush.Returns the legend border pen.intReturns the number of legend columns.Returns the legend column width.Returns the legend font.Returns the legend side.Returns the palette used for this chart.javax.vecmath.Matrix4fgetTitle()Returns the title that is put at the top of this chart.Returns the font used to draw the title.getType()Returns the type of this chart.protected voidInitialize the WebGL state when the widget is first shown.voidInitializes the chart layout.booleanReturns whether intersection lines are shown between surface charts.booleanReturns whether the legend is enabled.protected voidpaintGL()Update the client-side painting function.voidremove()Destructor.removeDataSeries(WAbstractDataSeries3D dataseries) Removes a dataseries from a chart.voidResizes the widget.protected voidresizeGL(int width, int height) Act on resize events.voidSets an axis.voidsetBackground(WColor background) Sets the background color for this chart.voidsetCameraMatrix(javax.vecmath.Matrix4f matrix) Set the camera-matrix.voidsetCubeLinesPen(WPen pen) Sets the pen used to draw the edges of the plotcube.final voidsetGridEnabled(Plane plane, Axis axis) Enable/disable gridlines.voidsetGridEnabled(Plane plane, Axis axis, boolean enabled) Enable/disable gridlines.voidsetGridLinesPen(WPen pen) Sets the pen used for drawing the gridlines.voidsetIntersectionLinesColor(WColor color) Sets the color of the intersection lines between surface charts.final voidSet whether intersection lines are shown between surface charts.voidsetIntersectionLinesEnabled(boolean enabled) Set whether intersection lines are shown between surface charts.voidsetIntersectionPlanes(List<WCartesian3DChart.IntersectionPlane> intersectionPlanes) Set the invisible planes with which intersections are drawn.voidsetLegendColumns(int columns, WLength columnWidth) Configures the number of columns and columnwidth of the legend.voidsetLegendEnabled(boolean enabled) Enables the legend.voidsetLegendLocation(Side side, AlignmentFlag alignment) Configures the location of the legend.voidsetLegendStyle(WFont font, WPen border, WBrush background) Configures the legend decoration.voidsetPalette(WChartPalette palette) Sets the palette for this chart.voidsetTitle(CharSequence title) Sets the title that is put on the chart.voidsetTitleFont(WFont titleFont) Sets the font that is used to draw the title.voidSets the type of this chart.doubletoPlotCubeCoords(double value, Axis axis) final voidupdateChart(ChartUpdates flag, ChartUpdates... flags) Update the chart.voidupdateChart(EnumSet<ChartUpdates> flags) Update the chart.protected voidupdateGL()Update state set ininitializeGL()Methods inherited from class eu.webtoolkit.jwt.WGLWidget
activeTexture, addJavaScriptMatrix4, addJavaScriptVector, attachShader, bindAttribLocation, bindBuffer, bindFramebuffer, bindRenderbuffer, bindTexture, blendColor, blendEquation, blendEquationSeparate, blendFunc, blendFuncSeparate, bufferData, bufferData, bufferData, bufferDatafv, bufferDatafv, bufferDatafv, bufferDataiv, bufferSubData, bufferSubData, bufferSubDatafv, bufferSubDatafv, bufferSubDatafv, bufferSubDataiv, clear, clear, clearBinaryResources, clearColor, clearDepth, clearStencil, colorMask, compileShader, contextRestored, copyTexImage2D, copyTexSubImage2D, createBuffer, createDomElement, createJavaScriptMatrix4, createJavaScriptVector, createPaintDevice, createProgram, createShader, createTexture, createTextureAndLoad, cullFace, debugger, deleteBuffer, deleteFramebuffer, deleteProgram, deleteRenderbuffer, deleteShader, deleteTexture, depthFunc, depthMask, depthRange, detachShader, disable, disableVertexAttribArray, drawArrays, drawElements, enable, enableClientErrorChecks, enableClientErrorChecks, enableVertexAttribArray, finish, flush, framebufferRenderbuffer, framebufferTexture2D, frontFace, generateMipmap, getAttribLocation, getCreateFramebuffer, getCreateRenderbuffer, getDomChanges, getRepaintSlot, getUniformLocation, hint, initJavaScriptMatrix4, initJavaScriptVector, injectJS, isRestoringContext, layoutSizeChanged, lineWidth, linkProgram, pixelStorei, polygonOffset, render, renderbufferStorage, repaintGL, repaintGL, sampleCoverage, scissor, setAlternativeContent, setClientSideLookAtHandler, setClientSideMouseHandler, setClientSideWalkHandler, setFormData, setJavaScriptMatrix4, setJavaScriptVector, setRenderOptions, setRenderOptions, shaderSource, stencilFunc, stencilFuncSeparate, stencilMask, stencilMaskSeparate, stencilOp, stencilOpSeparate, texImage2D, texImage2D, texImage2D, texImage2D, texImage2D, texImage2D, texParameteri, uniform1f, uniform1fv, uniform1fv, uniform1i, uniform1iv, uniform2f, uniform2fv, uniform2fv, uniform2i, uniform2iv, uniform3f, uniform3fv, uniform3fv, uniform3i, uniform3iv, uniform4f, uniform4fv, uniform4fv, uniform4i, uniform4iv, uniformMatrix2, uniformMatrix2fv, uniformMatrix3, uniformMatrix3fv, uniformMatrix4, uniformMatrix4, uniformMatrix4fv, useProgram, validateProgram, vertexAttrib1f, vertexAttrib2f, vertexAttrib2fv, vertexAttrib3f, vertexAttrib3fv, vertexAttrib4f, vertexAttrib4fv, vertexAttribPointer, viewport, webglNotAvailableMethods inherited from class eu.webtoolkit.jwt.WInteractWidget
clicked, doubleClicked, enterPressed, escapePressed, gestureChanged, gestureEnded, gestureStarted, getMouseOverDelay, isEnabled, keyPressed, keyWentDown, keyWentUp, load, mouseDragged, mouseMoved, mouseWentDown, mouseWentOut, mouseWentOver, mouseWentUp, mouseWheel, propagateSetEnabled, setDraggable, setDraggable, setDraggable, setDraggable, setMouseOverDelay, setPopup, touchEnded, touchMoved, touchStarted, unsetDraggableMethods inherited from class eu.webtoolkit.jwt.WWebWidget
addStyleClass, beingDeleted, blurred, callJavaScriptMember, childrenChanged, doJavaScript, enableAjax, escapeText, escapeText, escapeText, escapeText, find, findById, focussed, getAttributeValue, getBaseZIndex, getChildren, getClearSides, getDecorationStyle, getFloatSide, getHeight, getHtmlTagName, getId, getJavaScriptMember, getLineHeight, getMargin, getMaximumHeight, getMaximumWidth, getMinimumHeight, getMinimumWidth, getOffset, getPositionScheme, getScrollVisibilityMargin, getStyleClass, getTabIndex, getToolTip, getVerticalAlignment, getVerticalAlignmentLength, getWidth, hasFocus, hasStyleClass, isCanReceiveFocus, isDisabled, isHidden, isHiddenKeepsGeometry, isInline, isLoaded, isPopup, isRendered, isScrollVisibilityEnabled, isScrollVisible, isSetFirstFocus, isThemeStyleEnabled, isVisible, iterateChildren, jsStringLiteral, jsStringLiteral, manageWidget, parentResized, parentResized, propagateSetVisible, refresh, removeScript, removeStyleClass, scrollVisibilityChanged, setAttributeValue, setBaseZIndex, setCanReceiveFocus, setClearSides, setDecorationStyle, setDeferredToolTip, setDisabled, setFlexBox, setFloatSide, setFocus, setHidden, setHiddenKeepsGeometry, setHtmlTagName, setId, setInline, setJavaScriptMember, setLineHeight, setLoadLaterWhenInvisible, setMargin, setMaximumSize, setMinimumSize, setObjectName, setOffsets, setParentWidget, setPositionScheme, setScrollVisibilityEnabled, setScrollVisibilityMargin, setSelectable, setStyleClass, setTabIndex, setThemeStyleEnabled, setToolTip, setVerticalAlignment, unescapeText, updateSignalConnection, voidEventSignal, widgetAdded, widgetRemovedMethods inherited from class eu.webtoolkit.jwt.WWidget
acceptDrops, acceptDrops, addCssRule, addCssRule, addJSignal, addStyleClass, animateHide, animateShow, boxBorder, boxPadding, createJavaScript, disable, dropEvent, enable, getDropTouch, getJsRef, getParent, hide, htmlText, isExposed, isGlobalWidget, isLayoutSizeAware, needsRerender, positionAt, positionAt, positionAt, positionAt, removeFromParent, removeStyleClass, removeWidget, render, resize, scheduleRender, scheduleRender, scheduleRender, setClearSides, setDeferredToolTip, setFocus, setHeight, setHidden, setLayoutSizeAware, setMargin, setMargin, setMargin, setMargin, setMargin, setOffsets, setOffsets, setOffsets, setOffsets, setOffsets, setToolTip, setVerticalAlignment, setWidth, show, stopAcceptDrops, toggleStyleClass, toggleStyleClass, trMethods inherited from class eu.webtoolkit.jwt.WObject
getObjectName
-
Constructor Details
-
WCartesian3DChart
Constructor.Constructs a cartesian 3D chart, with the type set to
ChartType.Scatter, a transparent background, aPaletteFlavour.Mutedpalette and no gridlines. -
WCartesian3DChart
public WCartesian3DChart()Constructor. -
WCartesian3DChart
Constructor.Construct a cartesian 3D chart with the specified type, a transparent background, a
PaletteFlavour.Mutedpalette and no gridlines. -
WCartesian3DChart
Constructor.
-
-
Method Details
-
remove
public void remove()Destructor. -
addDataSeries
Add a dataseries to the chart.If the chart is of type
ChartType.Scatteronly numerical dataseries should be added and if it is of typeChartType.Categoryonly categorical dataseries should be added. If multiple categorical datasets are added, the axis-labels of the first dataseries will be used on the chart. -
removeDataSeries
Removes a dataseries from a chart. -
getDataSeries
Returns all dataseries that were added to this chart. -
axis
Returns the specified axis belonging to the chart. -
setAxis
Sets an axis.- See Also:
-
setGridEnabled
Enable/disable gridlines.Enables or disables gridlines in the given plane, along the given axis. All gridlines are by default disabled.
-
setGridEnabled
Enable/disable gridlines. -
setIntersectionLinesEnabled
public void setIntersectionLinesEnabled(boolean enabled) Set whether intersection lines are shown between surface charts.This is disabled by default.
-
setIntersectionLinesEnabled
public final void setIntersectionLinesEnabled()Set whether intersection lines are shown between surface charts. -
isIntersectionLinesEnabled
public boolean isIntersectionLinesEnabled()Returns whether intersection lines are shown between surface charts. -
setIntersectionLinesColor
Sets the color of the intersection lines between surface charts. -
getIntersectionLinesColor
Gets the color of the intersection lines between surface charts.- See Also:
-
setIntersectionPlanes
Set the invisible planes with which intersections are drawn.This plane is perpendicular to the given axis, and the intersection is shown in the given color.
Note that render times will take increasingly longer as you add more intersection planes.
-
getIntersectionPlanes
Get the invisible planes with which intersections are drawn. -
setGridLinesPen
Sets the pen used for drawing the gridlines.The default pen for drawing gridlines is a
StandardColor.Blackpen of width 0.- See Also:
-
getGridLinesPen
Returns the pen used for drawing the gridlines.- See Also:
-
setCubeLinesPen
Sets the pen used to draw the edges of the plotcube.The default pen for drawing cubelines is a
StandardColor.Blackpen of width 0.Note: Only width and color of the pen are used, all other styling is ignored.
-
getCubeLinesPen
Returns a reference to the pen used for drawing the edges of the plotcube.The width and color of the pen are used when drawing the edges of the plotcube
- See Also:
-
setType
Sets the type of this chart.Sets the type of this chart to either
ChartType.Scatter(for drawing numerical data) or toChartType.Category(for drawing categorical data). -
getType
Returns the type of this chart.- See Also:
-
setPalette
Sets the palette for this chart.Ownership of the
WChartPaletteis transferred to the chart.The given palette determines which color subsequent dataseries will have. If a dataseries has a colormap set, then the palette is not used for this data.
-
getPalette
Returns the palette used for this chart.- See Also:
-
setBackground
Sets the background color for this chart.This sets the GL-clearcolor. The default is transparant, which will cause the background to have the color set in css.
-
getBackground
Returns the background color used for this chart.- See Also:
-
setTitle
Sets the title that is put on the chart.The title is always put at the top of the chart and in the center.
- See Also:
-
getTitle
Returns the title that is put at the top of this chart. -
setTitleFont
Sets the font that is used to draw the title.The default font is the default constructed
WFont.- See Also:
-
getTitleFont
Returns the font used to draw the title. -
setLegendEnabled
public void setLegendEnabled(boolean enabled) Enables the legend.The location of the legend can be configured using
setLegendLocation(). Only series for which the legend is enabled are included in this legend.The default value is
false. -
isLegendEnabled
public boolean isLegendEnabled()Returns whether the legend is enabled.- See Also:
-
setLegendLocation
Configures the location of the legend.The provided
sidecan either beSide.Left,Side.Right,Side.Top,Side.Bottomand configures the side of the chart at which the legend is displayed.The
alignmentspecifies how the legend is aligned. This can be a horizontal alignment flag (AlignmentFlag.Left,AlignmentFlag.Center, orAlignmentFlag.Right), when thesideisSide.BottomorSide.Top, or a vertical alignment flag (AlignmentFlag.Top,AlignmentFlag.Middle, orAlignmentFlag.Bottom) when thesideisSide.LeftorSide.Right.The default location is
Side.RightandAlignmentFlag.Middle.- See Also:
-
setLegendStyle
Configures the legend decoration.This configures the font, border and background for the legend.
The default font is a 10pt sans serif font (the same as the default axis label font), the default
borderis PenStyle::None and the defaultbackgroundis BrushStyle::None.- See Also:
-
getLegendSide
Returns the legend side. -
getLegendAlignment
Returns the legend alignment. -
getLegendColumns
public int getLegendColumns()Returns the number of legend columns. -
getLegendColumnWidth
Returns the legend column width. -
getLegendFont
Returns the legend font. -
getLegendBorder
Returns the legend border pen. -
getLegendBackground
Returns the legend background brush. -
setLegendColumns
Configures the number of columns and columnwidth of the legend.The default value is a single column, 100 pixels wide.
-
initLayout
public void initLayout()Initializes the chart layout.This method must be called before any methods relating to the layout of the chart are called (eg. calling minimum() or maximum() on one of the axes). The method is also automatically called when the chart is rendered.
-
setCameraMatrix
public void setCameraMatrix(javax.vecmath.Matrix4f matrix) Set the camera-matrix.The viewpoint can be set with the camera-matrix. The chart is defined in the world coordinate system as a cube with axes from 0 to 1 in all three directions. Therefore the center of the cube is positioned at (0.5, 0.5, 0.5). The camera can be most easily position with the lookAt method of WMatrix4x4. A common use-case when manipulating the matrix is to translate the center to the origin and then rotate.
-
getCameraMatrix
public javax.vecmath.Matrix4f getCameraMatrix()Get the current camera-matrix.The matrix represents the current view on the scene. It corresponds to a coordinate system where the chart's axes run from 0 to 1 in all three directions.
-
getJsMatrix
Get the current camera matrix as a JavaScriptMatrix4x4.This JavaScriptMatrix4x4 can be used to implement a custom mouse handler using
WGLWidget#setClientSideMouseHandler(). -
getPMatrix
public javax.vecmath.Matrix4f getPMatrix() -
toPlotCubeCoords
-
initializeGL
protected void initializeGL()Initialize the WebGL state when the widget is first shown.Specialized for chart rendering.
- Overrides:
initializeGLin classWGLWidget
-
paintGL
protected void paintGL()Update the client-side painting function.Specialized for chart rendering.
-
updateGL
protected void updateGL()Update state set ininitializeGL()Specialized for chart rendering.
-
resizeGL
protected void resizeGL(int width, int height) Act on resize events.Specialized for chart rendering.
-
updateChart
Update the chart. -
updateChart
Update the chart. -
resize
Description copied from class:WWidgetResizes the widget.Specifies a fixed size for this widget, setting CSS
widthandheightproperties. By default a widget has automatic width and height, which sets a size for the widget following CSS rules.When the widget is not managed by a layout manager, the automatic (natural) size of a widget depends on whether the widget is a block or inline widget:
- a block widget takes by default the width of the parent, and the height that it needs based on its contents
- an inline widget takes the width and height that it needs based on its contents (possibly wrapping over multiple lines). The width and height of an inline widget cannot be changed (by the letter of CSS, although most browsers will react to it in varying ways).
When inserted in a layout manager, the size set will be used as a widget's preferred size, but the widget may be given a different size by the layout manager based on available space and stretch factors. The actual size given by a layout manager may be retrieved by making the widget "layout size aware", using
setLayoutSizeAware(). If you have defined a"wtResize()"JavaScript method for the widget, then this method will also be called.The default width and height of a widget is
WLength.Auto. -
createRay
public void createRay(double x, double y, javax.vecmath.GVector eye, javax.vecmath.GVector direction)
-