Class WAbstractGridData
- Direct Known Subclasses:
WEquidistantGridData,WGridData
General information can be found at WAbstractDataSeries3D. Information on how the
model is structured is provided in the subclasses. GridData can be represented in three ways.
This is indicated by Series3DType and can be either Series3DType.Point, Series3DType.Surface or Series3DType.Bar. Note that points and surfaces can only be
added to charts of type ChartType.Scatter, while bars can only be added to charts of type
ChartType.Category.
When the data is shown as a surface, a mesh can be added to the surface. This draws lines over the surface at the positions of the x- and y-values. For bar-series data, it is possible to adjust the width of the bars in both directions.
The three types of data-representation are illustrated below.
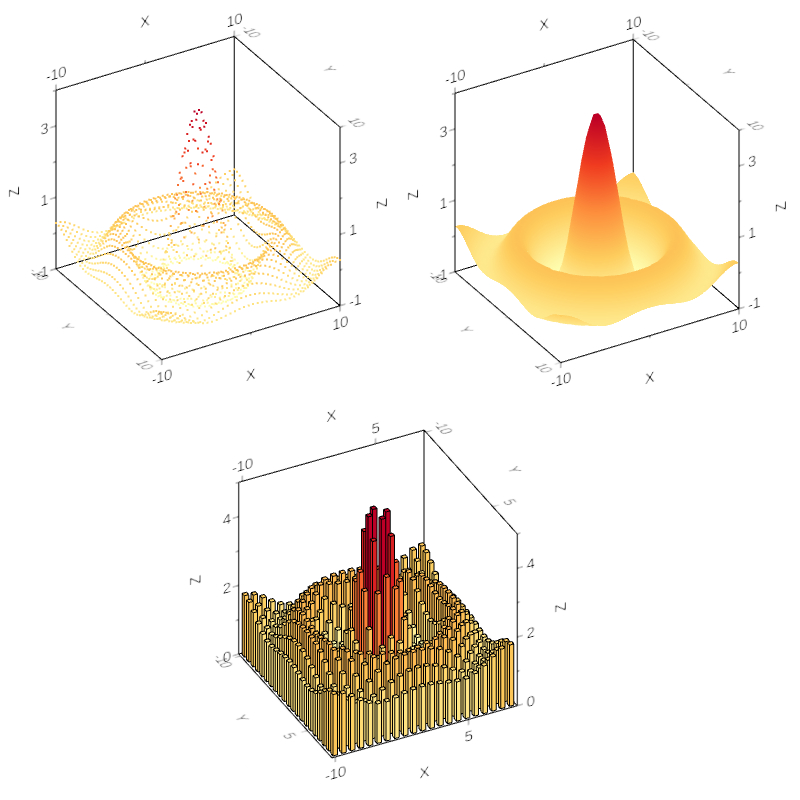
The three representation types of grid-based data
-
Nested Class Summary
Nested classes/interfaces inherited from class eu.webtoolkit.jwt.WObject
WObject.FormData -
Field Summary
FieldsModifier and TypeFieldDescriptionstatic final intstatic final intprotected static final floatFields inherited from class eu.webtoolkit.jwt.chart.WAbstractDataSeries3D
chart_, model_, pointSprite_ -
Constructor Summary
Constructors -
Method Summary
Modifier and TypeMethodDescriptionabstract WStringprotected abstract voidbarDataFromModel(List<ByteBuffer> simplePtsArrays) protected abstract voidbarDataFromModel(List<ByteBuffer> simplePtsArrays, List<ByteBuffer> coloredPtsArrays, List<ByteBuffer> coloredPtsColors) changeClippingMax(Axis axis) JSlotto change the value above which the data series will be clipped on the given axis.changeClippingMin(Axis axis) JSlotto change the value below which the data series will be clipped on the given axis.voidDelete GL resources.doubleReturns the bar-width in the X-axis direction.doubleReturns the bar-width in the Y-axis direction.Gets the color of the clipping lines.floatgetClippingMax(Axis axis) Gets the value above which the data series will be clipped on the given axis.floatgetClippingMin(Axis axis) Gets the value below which the data series will be clipped on the given axis.Get the color map for the isolines.Get all of the isoline levels.abstract intabstract intgetPen()Returns the pen that is used for drawing the mesh.getType()Returns the type of representation that will be used for the data.voidInitialize GL resources.booleanReturns whether clipping lines are enabled.booleanReturns whether the surface-mesh is enabled for this dataseries.abstract doubleReturns the computed maximum value of this dataseries along the given axis.abstract doubleReturns the computed minimum value of this dataseries along the given axis.voidpaintGL()Update the client-side painting function.pickBar(int x, int y) Return the bar that is closest to the look point at the given pixel.pickSurface(int x, int y) Find all points on the surface that are projected to the given pixel.voidresizeGL()Act on resize events.voidsetBarWidth(double xWidth, double yWidth) Sets the bar-width.voidsetChart(WCartesian3DChart chart) voidsetClippingLinesColor(WColor clippingLinesColor) Sets the color of the clipping lines.voidsetClippingLinesEnabled(boolean clippingLinesEnabled) Sets whether clipping lines should be drawn where a surface is clipped.voidsetClippingMax(Axis axis, float v) Set the value above which the data series will be clipped on the given axis.voidsetClippingMin(Axis axis, float v) Set the value below which the data series will be clipped on the given axis.voidsetIsoColorMap(WAbstractColorMap colormap) Set the color map for the isolines.voidsetIsoLevels(List<Double> isoLevels) Set isoline levels.voidSets theWPenthat is used for drawing the mesh.final voidEnables or disables a mesh for when a surface is drawn.voidsetSurfaceMeshEnabled(boolean enabled) Enables or disables a mesh for when a surface is drawn.voidsetType(Series3DType type) Sets the type of representation that will be used for the data.voidupdateGL()Update GL resources.Methods inherited from class eu.webtoolkit.jwt.chart.WAbstractDataSeries3D
getChart, getChartpaletteColor, getColorMap, getColorMapSide, getModel, getPointSize, getPointSprite, getPointSpriteTexture, getTitle, isColorMapVisible, isHidden, isLegendEnabled, loadPointSpriteTexture, setColorMap, setColorMapSide, setColorMapVisible, setColorMapVisible, setDefaultTitle, setHidden, setHidden, setLegendEnabled, setLegendEnabled, setModel, setPointSize, setPointSprite, setTitleMethods inherited from class eu.webtoolkit.jwt.WObject
getId, getObjectName, remove, setFormData, setObjectName, tr
-
Field Details
-
SURFACE_SIDE_LIMIT
public static final int SURFACE_SIDE_LIMIT- See Also:
-
BAR_BUFFER_LIMIT
public static final int BAR_BUFFER_LIMIT- See Also:
-
zeroBarCompensation
protected static final float zeroBarCompensation- See Also:
-
-
Constructor Details
-
WAbstractGridData
Constructor.
-
-
Method Details
-
minimum
Description copied from class:WAbstractDataSeries3DReturns the computed minimum value of this dataseries along the given axis.- Specified by:
minimumin classWAbstractDataSeries3D- See Also:
-
maximum
Description copied from class:WAbstractDataSeries3DReturns the computed maximum value of this dataseries along the given axis.- Specified by:
maximumin classWAbstractDataSeries3D- See Also:
-
setType
Sets the type of representation that will be used for the data.All representations in
Series3DTypeare possible for the data. Note thatSeries3DType.PointandSeries3DType.Surfacecan only be used on a chart that is configured as aChartType.ScatterandSeries3DType.Barcan only be used on a chart that is configured to be aChartType.Category.The default value is
Series3DType.Point. -
getType
Returns the type of representation that will be used for the data.- See Also:
-
setSurfaceMeshEnabled
public void setSurfaceMeshEnabled(boolean enabled) Enables or disables a mesh for when a surface is drawn.The default value is false. This option only takes effect when the type of this
WGridDataisSeries3DType.Surface. The mesh is drawn at the position of the x-axis and y-axis values. -
setSurfaceMeshEnabled
public final void setSurfaceMeshEnabled()Enables or disables a mesh for when a surface is drawn. -
isSurfaceMeshEnabled
public boolean isSurfaceMeshEnabled()Returns whether the surface-mesh is enabled for this dataseries.- See Also:
-
setBarWidth
public void setBarWidth(double xWidth, double yWidth) Sets the bar-width.This option only takes effect when the type of this
WGridDataisSeries3DType.Bar. The values provided should be between 0 and 1, where 1 lets the bars each take up 1/(nb of x/y-values) of the axis.The default bar-width is 0.5 in both directions.
-
getBarWidthX
public double getBarWidthX()Returns the bar-width in the X-axis direction. -
getBarWidthY
public double getBarWidthY()Returns the bar-width in the Y-axis direction. -
setPen
Sets theWPenthat is used for drawing the mesh.Used when drawing the mesh on a surface or the lines around bars. The default is a default constructed
WPen(black and one pixel wide).Note: only the width and color of this
WPenare used.- See Also:
-
getPen
Returns the pen that is used for drawing the mesh.- See Also:
-
pickSurface
Find all points on the surface that are projected to the given pixel.A ray is cast from the given pixel's x,y position (from the top left of the chart, in screen coordinates) and every intersection with the surface is returned, along with its distance from the look point. Note that the coordinates of the intersection points are interpolated between the data points that make up the surface.
-
pickBar
Return the bar that is closest to the look point at the given pixel.A ray is cast from the given pixel's x,y position (from the top left of the chart, in screen coordinates), and the closest bar on this
WAbstractGridDatais returned, along with its distance from the look point.Note that if this
WAbstractGridDatais hidden, this method still returns the closest bar as if it was visible. Also, if multiple bars are on the same bar chart, the bar that is returned may be behind another data series. Use the distance field of the returnedWBarSelectionto determine which data series is in front from the given angle.If there is no bar at the given pixel, then a selection with an invalid
WModelIndexis returned. The distance is then set to positive infinity. -
setIsoLevels
Set isoline levels.Isolines are drawn on the top or ground plane of the chart. Only applies if the type is
Series3DType.Surface.The isoline levels are set in the coordinate system of the item model.
-
getIsoLevels
Get all of the isoline levels. -
setIsoColorMap
Set the color map for the isolines.When no color map is defined for the isolines, i.e.
getIsoColorMap()is set to NULL, the color map of thisWAbstractGridDatawill be used.The isolines are only drawn if the type is
Series3DType.Surface. -
getIsoColorMap
Get the color map for the isolines. -
setClippingMin
Set the value below which the data series will be clipped on the given axis.This only affects data series whose type is
Series3DType.Surface. -
getClippingMin
Gets the value below which the data series will be clipped on the given axis.- See Also:
-
changeClippingMin
JSlotto change the value below which the data series will be clipped on the given axis.The
JSlottakes one extra argument: the value to clip below.The jsRef() of this
JSlotis only valid when thisWAbstractGridDatahas been added to aWCartesian3DChart. If thisWAbstractGridDatamoves to anotherWCartesian3DChart, the jsRef() of theJSlotchanges.- See Also:
-
setClippingMax
Set the value above which the data series will be clipped on the given axis.This only affects data series whose type is
Series3DType.Surface. -
getClippingMax
Gets the value above which the data series will be clipped on the given axis.- See Also:
-
changeClippingMax
JSlotto change the value above which the data series will be clipped on the given axis.The
JSlottakes one extra argument: the value to clip below.The jsRef() of this
JSlotis only valid when thisWAbstractGridDatahas been added to aWCartesian3DChart. If thisWAbstractGridDatamoves to anotherWCartesian3DChart, the jsRef() of theJSlotchanges.- See Also:
-
setClippingLinesEnabled
public void setClippingLinesEnabled(boolean clippingLinesEnabled) Sets whether clipping lines should be drawn where a surface is clipped.Clipping lines are disabled by default. Note that rendering will be significantly slower when enabled.
-
isClippingLinesEnabled
public boolean isClippingLinesEnabled()Returns whether clipping lines are enabled. -
setClippingLinesColor
Sets the color of the clipping lines. -
getClippingLinesColor
Gets the color of the clipping lines. -
getNbXPoints
public abstract int getNbXPoints() -
getNbYPoints
public abstract int getNbYPoints() -
axisLabel
-
setChart
- Overrides:
setChartin classWAbstractDataSeries3D
-
getGlObjects
- Overrides:
getGlObjectsin classWAbstractDataSeries3D
-
initializeGL
public void initializeGL()Description copied from class:WAbstractDataSeries3DInitialize GL resources.This function is called by
initializeGL()in the chart to which this dataseries was added.- Specified by:
initializeGLin classWAbstractDataSeries3D
-
paintGL
public void paintGL()Description copied from class:WAbstractDataSeries3DUpdate the client-side painting function.This function is called by
paintGL()in the chart to which this dataseries was added.- Specified by:
paintGLin classWAbstractDataSeries3D
-
updateGL
public void updateGL()Description copied from class:WAbstractDataSeries3DUpdate GL resources.This function is called by
updateGL()in the chart to which this dataseries was added. Before this function is called,deleteAllGLResources()is called.- Specified by:
updateGLin classWAbstractDataSeries3D- See Also:
-
resizeGL
public void resizeGL()Description copied from class:WAbstractDataSeries3DAct on resize events.This function is called by
resizeGL()in the chart to which this dataseries was added.- Specified by:
resizeGLin classWAbstractDataSeries3D
-
deleteAllGLResources
public void deleteAllGLResources()Description copied from class:WAbstractDataSeries3DDelete GL resources.This function is called by
updateGL()in the chart to which this dataseries was added.- Specified by:
deleteAllGLResourcesin classWAbstractDataSeries3D
-
barDataFromModel
-
barDataFromModel
protected abstract void barDataFromModel(List<ByteBuffer> simplePtsArrays, List<ByteBuffer> coloredPtsArrays, List<ByteBuffer> coloredPtsColors)
-