Class WPieChart
A pie chart renders a single data series as segments of a circle, so that the area of each segment is proportional to the value in the data series.
To use a pie chart, you need to set a model using WAbstractChart#setModel(), and use setLabelsColumn() and setDataColumn() to specify the model column that
contains the category labels and data.
The pie chart may be customized visually by enabling a 3D effect (setPerspectiveEnabled()), or by
specifying the angle of the first segment. One or more segments may be exploded, which separates
the segment from the rest of the pie chart, using setExplode().
The segments may be labeled in various ways using setDisplayLabels().
CSS
Styling through CSS is not applicable.
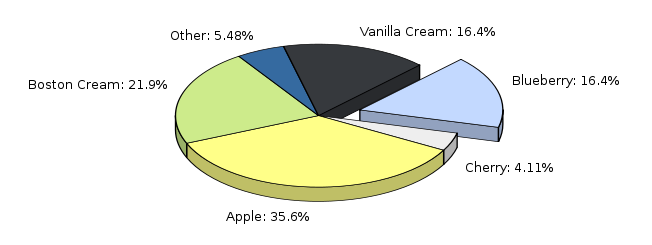
Example of a pie chart
- See Also:
-
Nested Class Summary
Nested classes/interfaces inherited from class eu.webtoolkit.jwt.WObject
WObject.FormData -
Field Summary
Fields inherited from class eu.webtoolkit.jwt.WInteractWidget
dragTouchEndSlot_, dragTouchSlot_, noDefault -
Constructor Summary
ConstructorsConstructorDescriptionCreates a new pie chart.WPieChart(WContainerWidget parentContainer) Creates a new pie chart. -
Method Summary
Modifier and TypeMethodDescriptionvoidaddDataPointArea(int row, int column, WAbstractArea area) Adds a data point area (used for displaying e.g.final WContainerWidgetcreateLabelWidget(WWidget textWidget, WPainter painter, WRectF rect, AlignmentFlag alignmentFlag, AlignmentFlag... alignmentFlags) createLabelWidget possition textWidget where the text would be rendered.createLabelWidget(WWidget textWidget, WPainter painter, WRectF rect, EnumSet<AlignmentFlag> alignmentFlags) createLabelWidget possition textWidget where the text would be rendered.final WWidgetcreateLegendItemWidget(int index, LabelOption option, LabelOption... options) Creates a widget which renders the a legend item.createLegendItemWidget(int index, EnumSet<LabelOption> options) Creates a widget which renders the a legend item.protected voiddrawLabel(WPainter painter, WRectF rect, EnumSet<AlignmentFlag> alignmentFlags, CharSequence text, int row) drawLabel draw a label on the chart.doubleReturns the percentage to avoid label rendering.getBrush(int modelRow) Returns the brush used for a pie segment.intReturns the model column used for the data.Returns options set for displaying labels.doublegetExplode(int modelRow) Returns the explosion factor for a segment.Returns the label format string.intReturns the model column used for the labels.doubleReturns the angle of the first segment.booleanReturns whether a 3D effect is enabled.booleanReturns whether a shadow effect is enabled.protected voidprotected voidvoidPaint the chart in a rectangle of the given painter.protected voidpaintEvent(WPaintDevice paintDevice) Paints the widget.voidsetAvoidLabelRendering(double avoidLabelRendering) Sets the percentage value to avoid rendering of label texts.voidCustomizes the brush used for a pie segment.voidsetDataColumn(int modelColumn) Sets the model column that holds the data.final voidsetDisplayLabels(LabelOption option, LabelOption... options) Configures if and how labels should be displayed.voidsetDisplayLabels(EnumSet<LabelOption> options) Configures if and how labels should be displayed.voidsetExplode(int modelRow, double factor) Sets the explosion factor for a pie segment.voidsetLabelFormat(CharSequence format) Sets the label format.voidsetLabelsColumn(int modelColumn) Sets the model column that holds the labels.final voidsetPerspectiveEnabled(boolean enabled) Enables a 3D perspective effect on the pie.voidsetPerspectiveEnabled(boolean enabled, double height) Enables a 3D perspective effect on the pie.voidsetShadowEnabled(boolean enabled) Enables a shadow effect.voidsetStartAngle(double startAngle) Sets the angle of the first segment.Methods inherited from class eu.webtoolkit.jwt.chart.WAbstractChart
getBackground, getItemModel, getModel, getPalette, getPlotAreaPadding, getTitle, getTitleFont, isAutoLayoutEnabled, paint, remove, setAutoLayoutEnabled, setAutoLayoutEnabled, setBackground, setModel, setModel, setPalette, setPlotAreaPadding, setPlotAreaPadding, setPlotAreaPadding, setTitle, setTitleFontMethods inherited from class eu.webtoolkit.jwt.WPaintedWidget
addArea, createDomElement, createJSBrush, createJSPainterPath, createJSPen, createJSPoint, createJSRect, createJSTransform, enableAjax, getArea, getAreas, getCreatePaintDevice, getDomChanges, getMethod, getObjJsRef, getPreferredMethod, getRepaintSlot, insertArea, layoutSizeChanged, refresh, removeArea, render, resize, setFormData, setPreferredMethod, update, update, updateMethods inherited from class eu.webtoolkit.jwt.WInteractWidget
clicked, doubleClicked, enterPressed, escapePressed, gestureChanged, gestureEnded, gestureStarted, getMouseOverDelay, isEnabled, keyPressed, keyWentDown, keyWentUp, load, mouseDragged, mouseMoved, mouseWentDown, mouseWentOut, mouseWentOver, mouseWentUp, mouseWheel, propagateSetEnabled, setDraggable, setDraggable, setDraggable, setDraggable, setMouseOverDelay, setPopup, touchEnded, touchMoved, touchStarted, unsetDraggableMethods inherited from class eu.webtoolkit.jwt.WWebWidget
addStyleClass, beingDeleted, blurred, callJavaScriptMember, childrenChanged, doJavaScript, escapeText, escapeText, escapeText, escapeText, find, findById, focussed, getAttributeValue, getBaseZIndex, getChildren, getClearSides, getDecorationStyle, getFloatSide, getHeight, getHtmlTagName, getId, getJavaScriptMember, getLineHeight, getMargin, getMaximumHeight, getMaximumWidth, getMinimumHeight, getMinimumWidth, getOffset, getPositionScheme, getScrollVisibilityMargin, getStyleClass, getTabIndex, getToolTip, getVerticalAlignment, getVerticalAlignmentLength, getWidth, hasFocus, hasStyleClass, isCanReceiveFocus, isDisabled, isHidden, isHiddenKeepsGeometry, isInline, isLoaded, isPopup, isRendered, isScrollVisibilityEnabled, isScrollVisible, isSetFirstFocus, isThemeStyleEnabled, isVisible, iterateChildren, jsStringLiteral, jsStringLiteral, manageWidget, parentResized, parentResized, propagateSetVisible, removeScript, removeStyleClass, scrollVisibilityChanged, setAttributeValue, setBaseZIndex, setCanReceiveFocus, setClearSides, setDecorationStyle, setDeferredToolTip, setDisabled, setFlexBox, setFloatSide, setFocus, setHidden, setHiddenKeepsGeometry, setHtmlTagName, setId, setInline, setJavaScriptMember, setLineHeight, setLoadLaterWhenInvisible, setMargin, setMaximumSize, setMinimumSize, setObjectName, setOffsets, setParentWidget, setPositionScheme, setScrollVisibilityEnabled, setScrollVisibilityMargin, setSelectable, setStyleClass, setTabIndex, setThemeStyleEnabled, setToolTip, setVerticalAlignment, unescapeText, updateSignalConnection, voidEventSignal, widgetAdded, widgetRemovedMethods inherited from class eu.webtoolkit.jwt.WWidget
acceptDrops, acceptDrops, addCssRule, addCssRule, addJSignal, addStyleClass, animateHide, animateShow, boxBorder, boxPadding, createJavaScript, disable, dropEvent, enable, getDropTouch, getJsRef, getParent, hide, htmlText, isExposed, isGlobalWidget, isLayoutSizeAware, needsRerender, positionAt, positionAt, positionAt, positionAt, removeFromParent, removeStyleClass, removeWidget, render, resize, scheduleRender, scheduleRender, scheduleRender, setClearSides, setDeferredToolTip, setFocus, setHeight, setHidden, setLayoutSizeAware, setMargin, setMargin, setMargin, setMargin, setMargin, setOffsets, setOffsets, setOffsets, setOffsets, setOffsets, setToolTip, setVerticalAlignment, setWidth, show, stopAcceptDrops, toggleStyleClass, toggleStyleClass, trMethods inherited from class eu.webtoolkit.jwt.WObject
getObjectName
-
Constructor Details
-
WPieChart
Creates a new pie chart. -
WPieChart
public WPieChart()Creates a new pie chart.
-
-
Method Details
-
setLabelsColumn
public void setLabelsColumn(int modelColumn) Sets the model column that holds the labels.The labels are used only when
setDisplayLabels()is called with theLabelOption.TextLabeloption.The default value is -1 (not defined).
-
getLabelsColumn
public int getLabelsColumn()Returns the model column used for the labels.- See Also:
-
setDataColumn
public void setDataColumn(int modelColumn) Sets the model column that holds the data.The data column should contain data that can be converted to a number, but should not necessarily be of a number type, see also
StringUtils.asNumber(Object).The default value is -1 (not defined).
- See Also:
-
getDataColumn
public int getDataColumn()Returns the model column used for the data.- See Also:
-
setBrush
Customizes the brush used for a pie segment.By default, the brush is taken from the
WAbstractChart.getPalette(). You can use this method to override the palette's brush for a particular modelRow. -
getBrush
Returns the brush used for a pie segment.- See Also:
-
setExplode
public void setExplode(int modelRow, double factor) Sets the explosion factor for a pie segment.Separates the segment corresponding to model row modelRow from the rest of the pie. The factor is a positive number that represents the distance from the center as a fraction of the pie radius. Thus, 0 corresponds to no separation, and 0.1 to a 10% separation, and 1 to a separation where the segment tip is on the outer perimeter of the pie.
The default value is 0.
-
getExplode
public double getExplode(int modelRow) Returns the explosion factor for a segment.- See Also:
-
setPerspectiveEnabled
public void setPerspectiveEnabled(boolean enabled, double height) Enables a 3D perspective effect on the pie.A 3D perspective effect is added, which may be customized by specifying the simulated height of the pie. The height is defined as a fraction of the pie radius.
The default value is false.
-
setPerspectiveEnabled
public final void setPerspectiveEnabled(boolean enabled) Enables a 3D perspective effect on the pie. -
isPerspectiveEnabled
public boolean isPerspectiveEnabled()Returns whether a 3D effect is enabled. -
setShadowEnabled
public void setShadowEnabled(boolean enabled) Enables a shadow effect.A soft shadow effect is added.
The default value is false.
-
isShadowEnabled
public boolean isShadowEnabled()Returns whether a shadow effect is enabled.- See Also:
-
setStartAngle
public void setStartAngle(double startAngle) Sets the angle of the first segment.The default value is 45 degrees.
-
getStartAngle
public double getStartAngle()Returns the angle of the first segment.- See Also:
-
setAvoidLabelRendering
public void setAvoidLabelRendering(double avoidLabelRendering) Sets the percentage value to avoid rendering of label texts.The default value is 0 percent.
-
getAvoidLabelRendering
public double getAvoidLabelRendering()Returns the percentage to avoid label rendering. -
setDisplayLabels
Configures if and how labels should be displayed.The options must be the logical OR of a placement option (
LabelOption.InsideorLabelOption.Outside) andLabelOption.TextLabeland/orLabelOption.TextPercentage. If bothLabelOption.TextLabelandLabelOption.TextPercentageare specified, then these are combined as "<label>: <percentage>".The default value is
LabelOption.None. -
setDisplayLabels
Configures if and how labels should be displayed. -
getDisplayLabels
Returns options set for displaying labels.- See Also:
-
setLabelFormat
Sets the label format.Sets a format string which is used to format label (percentage) values.
The format string must be a format string that is accepted by snprintf() and which formats one double.
The default value is "%.3g%%".
- See Also:
-
getLabelFormat
Returns the label format string.- See Also:
-
createLegendItemWidget
Creates a widget which renders the a legend item.Depending on the passed LabelOption flags, the legend item widget, will contain a text (with or without the percentage) and/or a span with the segment's color.
-
createLegendItemWidget
Creates a widget which renders the a legend item.Returns
createLegendItemWidget(index, EnumSet.of(option, options)) -
addDataPointArea
Adds a data point area (used for displaying e.g. tooltips).You may want to specialize this is if you wish to modify (or delete) the area.
Note: Currently, an area is only created if the
ItemDataRole.ToolTipdata at the data point is not empty. -
createLabelWidget
public WContainerWidget createLabelWidget(WWidget textWidget, WPainter painter, WRectF rect, EnumSet<AlignmentFlag> alignmentFlags) createLabelWidget possition textWidget where the text would be rendered. Assuming that textWidget is added to a container with same dimensions as theWPieChart. This should be used in combinaltion withdrawLabel(). -
createLabelWidget
public final WContainerWidget createLabelWidget(WWidget textWidget, WPainter painter, WRectF rect, AlignmentFlag alignmentFlag, AlignmentFlag... alignmentFlags) createLabelWidget possition textWidget where the text would be rendered. Assuming that textWidget is added to a container with same dimensions as theWPieChart. This should be used in combinaltion withdrawLabel().Returns
createLabelWidget(textWidget, painter, rect, EnumSet.of(alignmentFlag, alignmentFlags)) -
paint
Description copied from class:WAbstractChartPaint the chart in a rectangle of the given painter.Paints the chart inside the painter, in the area indicated by rectangle. When rectangle is a null rectangle, the entire painter
WPainter.getWindow()is used.- Specified by:
paintin classWAbstractChart
-
paintEvent
Description copied from class:WPaintedWidgetPaints the widget.You should reimplement this method to paint the contents of the widget, using the given paintDevice.
- Specified by:
paintEventin classWPaintedWidget
-
drawLabel
protected void drawLabel(WPainter painter, WRectF rect, EnumSet<AlignmentFlag> alignmentFlags, CharSequence text, int row) drawLabel draw a label on the chart. Will be called by paint.You may want to specialize this if you wish to replace the label by a widget. @see WPieChart#createLabelWidget(WWidget textWidget, WPainter painter, WRectF rect, EnumSet alignmentFlags)
-
modelChanged
protected void modelChanged()- Overrides:
modelChangedin classWAbstractChart
-
modelReset
protected void modelReset()- Overrides:
modelResetin classWAbstractChart
-